Geology and Natural Heritage of the Long Valley Caldera
Hydrology of Hydrothermal Systems in the Long Valley Caldera
M Zaret
Abstract
Hydrothermal activity in the Long Valley Caldera has had many different periods in its history of activity and fluctuation. Predicted temperatures of the hydrothermal fluids are much higher than what are actually found underneath the Resurgent Dome and surrounding areas. Much of the system is observed by drill holes and wells that measure the temperatures of the hydrothermal fluid. The geothermal systems and hydrothermal systems have been documented and observed closely by dozens of scientists giving us decades of data to make inferences and interpretations. Much of the interpretation has been substantiated by people such as Michael L. Sorey, Christopher D. Farrar, and David D. Blackwell along with many others. While most of today’s interpretations fall heavily on heat transport models made from the drill holes, new techniques such as geoelectrical sounding have helped paint a clearer picture of what is going on beneath the Caldera. The exact movement of the present day hydrothermal fluids is generally understood and its source is presumed to be a magmatic intrusion from the Mono-Inyo Crater Chain. But the specifics behind its origin and path of travel vary depending on how the data is interpreted. Even though most geologists are in agreement about the source of today’s relatively shallow hydrothermal system, I believe that additional exploratory wells and further deep electrical sounding could lead to more definite answers.
Introduction
760,000 years ago the Long Valley Eruption changed the land and its surroundings immensely. The caldera and magma chamber of Long Valley created an area of large scale volcanic activity that lasted for hundreds of thousands of years. As the beds of lava and underlying magma started cooling, deep circulation of both meteoric and juvenile waters created a lively hydrothermal system. But as mineral deposition and the cooling of magma occurred over time, the hydrothermal system ceased to exist, leaving behind its traces. In Eastern California today we have a shallow hydrothermal system that is of the same origin but on a different scale. A magmatic intrusion that formed the Mono-Inyo Craters a mere 600 years ago is the new source of heat that allows hydrothermal fluids to travel through aquifers from west to east eventually discharging in places such as Hot Creek Gorge. The Resurgent Dome is a site where volcanic and hydrothermal activities are especially prominent. The evidence of a large bodied magma chamber beneath the dome had scientists assuming that the temperatures would be extremely high, akin to Yellowstone. But what they found were temperatures much lower than expected and since then there has been rigorous monitoring and experimentation to uncover the hydrology of the hydrothermal system surrounding the Resurgent Dome and the LVC (Long Valley Caldera).
Hydrothermal Systems Summary
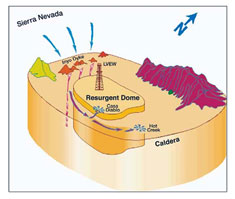
Geothermal systems and the hydrothermal systems are an occurrence that happens around the Earth so a summary of how they work is described. A system of groundwater circulation will exist in a given area. The circulation is at great depths and high temperatures. The force that drives most of the circulation is the thermal buoyancy that brings the water up as it rises in temperature. For large scale systems, it takes hundreds of thousands of years for the circulation to exist. The lower half of the circulation’s paths is kept open by the mixing of the cold water with the heat source, creating a dissolution that keeps the pathways open. In the upper half however, the pathways can change over time because of the deposition of precipitating minerals as the hot fluid cools. The direction and function of these changes depend heavily on the tectonic and volcanic activity. To understand the finer points of this research paper a summary of geothermal systems and the hydrology of the hydrothermal systems will paint a clearer picture. Below is a diagram made by Sorey (1985) that depicts this system in the caldera and gives an idea of how the circulation in a hydrothermal system works.
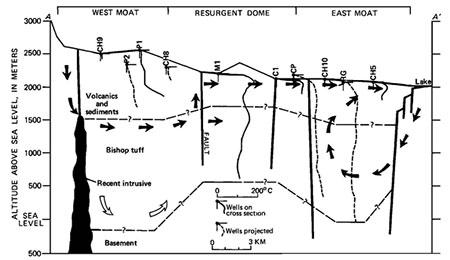
Temperature profiles in wells located in Long Valley caldera along or projected onto section AA’ (see Figure 5). Contacts at the top and bottom of the Bishop Tuff are shown as solid lines where control is provided by well data and by dashed lines where control is provided by seismic and gravity data. Inferred directions of fluid flow in the present-day hydrothermal system are indicated by solid arrows. Deeper circulation beneath the west moat during previous periods of activity is indicated by open arrows.
Observations
The Long Valley Caldera has had a long history of close observation by many scientists. David Blackwell does an excellent job of grouping the older data together to give more straight forward idea of how the Caldera has been observed. "Geophysical studies of the area have been numerous and detailed." (Blackwell 1985) The USGS is responsible for much of the studies found in the caldera with Black giving recognition to Muffler and Williams and their work, Geothermal Investigations of the U.S Geological Survey in Long Valley, California, 1972-73. The geologic history is well outlined from observations by Roy Bailey and others in their work, Volcanism, Structure and Geochronology of Long Valley caldera, Mono County, California, 1976. Martin F. Kane and others are responsible for observing the geometry of the caldera fill by gravitational studies and magnetic studies in their work, A Gravity and Magnetic Investigation of Long Valley Caldera, Mono County, California, 1976. The evidence for a modern magma chamber was observed by David P. Hill and others using seismic activity in their work, Structure of Long Valley Caldera, California, from a Seismic Refraction Experiment, 1976. C.O Sanders expanded on Hill’s work and discovered evidence of still liquid magma chambers beneath the Resurgent Dome at about 5km. This evidence was based off of P and S wave attention and shadow zones in his work, Locations and Configurations of Magma Bodies beneath Long Valley, California, Determined by Anomalous Earthquake Signals, 1984. The regional thermal setting along with the conduction and convection associated with the shallow hydrothermal system was observed and described by A.H Lachenbruch along with Sorey and others in the two works, Geothermal Settings and Heat Conduction Models for the Long Valley Caldera, 1976, and The Near-Surface Hydrothermal Regime of Long Valley caldera, 1976. Lachenbruch, Sorey and a man named Diment paid particularly close attention to temperature gradient and heat study data done in numerous shallow (>30m) and intermediate drill holes (50-300m). Sorey and others used this data to describe the groundwater hydrologic regime of the caldera in their work, The Hydrothermal System of Long Valley, California, 1978. All of these people that Blackwell cites in his paper are the people who have done the initial ground work to get the raw data. What Blackwell has compiled together is the caldera’s hydrothermal system as a whole, using the data from all these interconnecting sources. A model of the system and a chart of temperature profiles are the results of the geologists work.
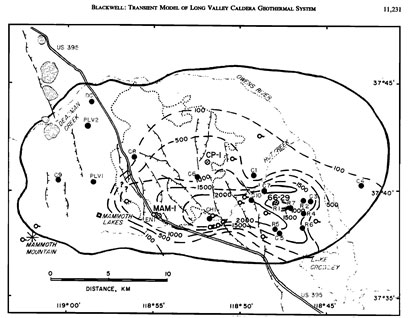
Location of holes in and shallow heat flow map of the Long Valley caldera. The outline of the physiographic edge of the caldera is shown as a solid line. The dotted line represents the outline of the resurgent dome; dashed lines with tick marks represent mapped normal faults (the Hilton Creek fault zone) and the ruled pattern indicates the young rhyolite domes of the Inyo domes complex. Locations (solid circles) and identifying numbers for each hole are shown. Deep holes are indicated by circled crosses. Locations of the major hot springs and fumeroles are shown by open circle spring symbols. Contours of heat loss from the shallow aquifer (dark lines) are in units of milliwatts per square meter (1 x 10⁻⁶ cal/cm2 s = 41.84 mW m-1).
Temperature profiles in core holes and shallow water level holes (unlabeled) in Long Valley caldera [from Sorey et al., 1978]. Roman numerals identify groups of profiles associated with similar hydrologic conditions, as discussed in text.
Temperature Data
Pribnow observed that the discharge temperature had a difference of about 50 degrees Celsius within a few kilometers. Sorey and Diment are cited in Blackwell’s paper with the same variations in temperature. The depths of the drill holes are also an important indicator of temperature differences as Pribnow points out. A lot of the boreholes used for temperature gauging are shallow reaching a depth of less than 30 m. Some intermediate boreholes attain depths up to 300 m while about a dozen go to depths up to 900 m. The most significant and deepest borehole is the Long Valley Exploratory Well in the center of the resurgent dome. Pribnow also notes that the highest temperatures are found at the sites of discharge at Hot Creek and Lake Crowley in the eastern half of the caldera. All of these observations that are reflected in the paper indicate that the resurgent dome is the area of interest. Pribnow expands on these observations by going into detail on temperature data in the resurgent dome. The paper goes on to describe the rising and lowering of temperatures or reversals in temperature that occur as the depth increases. The temperature logs of the various boreholes on the resurgent dome show these varying ranges of temperature and fluctuation depending on their location on the resurgent dome.
Lithology under LVEW
Pribnow describes the lithology that is mapped out based on the drilling done at the Long Valley Exploratory Well. The upper most layers are of the Early Rhyolite made up of post caldera sediments and volcanic rocks. There are shallow and lower rhyolites that subdivide the Early Rhyolite and this top portion go to a depth of 620 m. What follows the Early Rhyolite is the Bishop Tuff which is an 1178-m-thick interval that has dikes and sills in it produced by the Early Rhyolite. Below the Bishop Tuff is a Mystery Breccia that is 92-m-thick. It is made up of angular clasts of basement related metasiltstones and volcanic rocks that are very fine grained. What follows the Mystery Breccia is 133 m of Mesozoic metavolcanic rocks. The bottom portion that is reached is the Sierra Nevada basement rock that is composed of Paleozoic metasedimentary rocks. What Pribnow observes matches the findings and studies done by the USGS and people such as Roy Bailey.
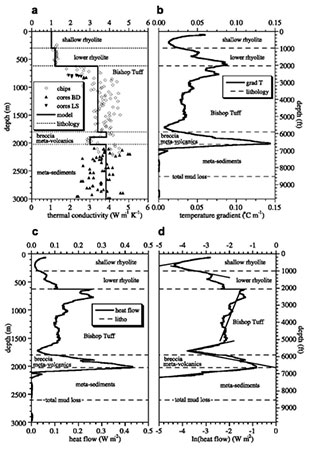
Thermal Conductivity from LVEW
Pribnow and others created a detailed thermal conductivity profile for LVEW. They made the profile at a geothermal laboratory of the USGS where they looked at chip and core samples using divided bar and needle probe instruments. What they found was that the thermal conductivity increased the lower the depth got. The Early Rhyolite section in the top 600 m had relatively low thermal conductivity in relation to the rock beneath it. The thermal conductivity profiles are shown below.
Pribnow’s data matched the trends done by conductivity values that had been made by Sorey, Blackwell and Lachenbruch. These three geologists used cutting and cores to determine the thermal conductivity values. The trend of greater thermal conductivity at greater depths is then generally agreed upon by these geologists. Pribnow noted that the shallow volcanic rock’s low thermal conductivity meant a much higher temperature gradient in the Early Rhyolite compared to the basement rock.
Geoelectrical Resistivity survey in Long Valley
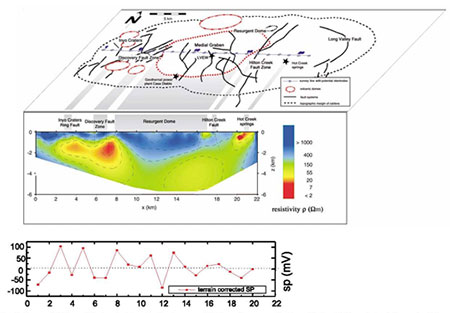
Pribnow uses a geoelectrical resistivity survey to better understand the hydrothermal regime and the fluid flow of Long Valley. The zones of active hydrothermal flow and fault systems are most commonly mapped out using electrical sounding methods. Pribnow describes the method and past surveys done with similar techniques. With the variation in fluid salinity, porosity, mineral alteration and temperature, geologists are able to produce measurable contrasts of electrical resistivity. This method that Pribnow uses is called Electrical Resistivity Tomography or (ERT). Using multiple receivers, the upper crust is mapped out using measurements from the multiple areas of transmitter-receiver interaction. The accuracy and resolution of the results relies heavily on the amount and quality of data. This method of observation allows a 2-D and 3-D investigation of the sub surface bodies. Below is the resulting model from the survey.
Inverted 2-D model of resistivity distribution on a W E profile across the Long Valley Caldera derived from C-C measurements 2000 (top) and self-potential anomalies (SP, bottom) (main faults after Suermnicht and Varga, 1988; Bailey, 1989).
From the profile, Pribnow observed that the eastern half of the caldera had low resistivity areas at depths greater than 4 km while the western half had low resistivity areas at depths between 1 and 3 km.
Interpretations and Discussion
Blackwell, Sorey and Pribnow all give their own input on the data that has been collected in the caldera and around the resurgent dome. Because Blackwell’s paper is older than the other two, there are interpretations that have since then been verified. At the same time in Blackwell’s paper there are assumptions that are still being made today with similar curiosity and unknowing. Sorey’s 2003 paper makes some general assumptions while Farrar’s and Pribnow›s papers are a little more bold and advantageous.
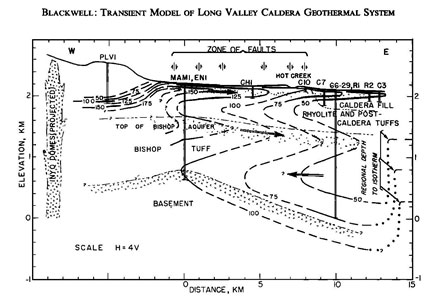
Transient Models
Blackwell interpretation was looking at the shapes of the temperature depth curves. He would then compare his interpretations do geologic and hydrologic data to infer on structure of the hydrothermal system and its hydrology. Using a simple analytical model, Blackwell created an image showing the transient flow of hot water in an aquifer. Blackwell’s interpretations put together a model of the geothermal and hydrothermal systems underlying the caldera and since then, everything in the model has proven to stay true to the form Blackwell has assumed. The model is shown below.
Conceptual model of the geothermal system in the southern half of the Long Valley caldera. The lithologic data are taken from published reports by Smith and Rex (1977), Petroleum Information Corporation (1980), and Gambill (1981). Location and sense of displacement at the surface along the normal faults associated with the Hilton Creek fault zone are shown. The presence of two temperature inversions associated with the shallow aquifer and the "top of the Bishop" aquifer are shown by dot pattern. The presence of subnormal temperatures in the eastern part of the caldera is indicated by comparison with the regional isotherms (see extreme right-hand side of figure) base on an assumed typical heat flow of 80 mW m-1. Large arrows diagramically depict water flow directions.
Seismicity and Deformation
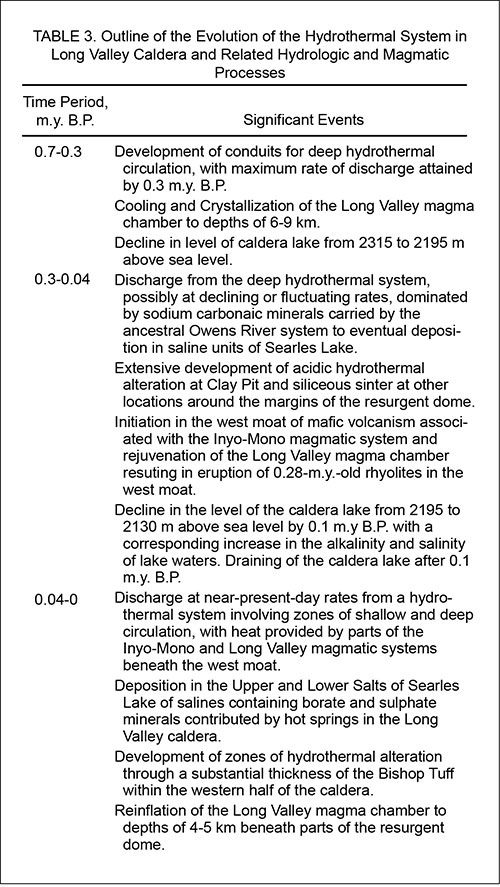
Sorey noted that the 80 cm uplift of the resurgent dome since the late 1970’s implied a volume increase in the magma body underneath it. Sorey expands on this interpretation saying that the deformation and seismicity of Long Valley Caldera is caused by the simple process of magmatic intrusions. It is implied that much of the interpretations in Sorey’s paper are intended to promote the continue of monitoring and observation of the caldera, "to provide a basis for ’judging whether an evolving unrest episode has the potential for culminating in a volcanic eruption.‘" (Sorey 2003) The basis for the arguments and interpretations made in the paper rely on studies and inferences on the history of the caldera. Below shows a timeline created by Sorey that gives the sequence of events of the hydrothermal systems in the caldera.
History and Structure
Pribnow makes some of his earlier assumptions in the paper based on data and inferences made by Lachenbruch, Blackwell and Sorey. Looking back on Lachenbruch, the paper infers on the magma chamber based on Lachenbruch’s observations. Pribnow notes that the east caldera’s rim has a lack of high heat flow which would imply that the Bishop Tuff event drained the magma chamber in the area leaving behind a smaller chamber that is more restricted to the western half of the caldera and the resurgent dome. He expands on this thought saying that the high heat flow found in the West Moat could imply a relatively recent magma intrusion as the source. An analytical model made by Blackwell is another thing Pribnow uses to make inferences off of. The model Blackwell made suggests that the flow system of today is made up of two aquifers with lateral flow. The velocities of these flows are ranged at 100-230 meters per a year. Blackwell infers based off data that the shallow aquifer which is located between 20-120 meters has been active for 500-700 years. The second and deeper aquifer which reaches depths to about 700 meters is around 3000 years old. Blackwell notes that the lateral flow is continuous in both aquifers and the direction in both is from west to east. Pribnow uses these interpretations to infer that the high reservoir temperatures’ source is from shallow intrusions and that a large magma chamber would not be required. A conceptual model made by Sorey and others is used by Pribnow to expand on the interpretations made before. Using interpretations taken from geochemical, hydrological and thermal data, Pribnow infers that the hot fluids in the area of the Inyo Craters upwells and mixes with fluids coming down from the Sierra Nevada Mountains. These fluids then flow eastwards. The hot fluids take a bend south when the fluids reach the western border of the resurgent dome. At Hot Creek and Casa Diablo in the east, these hot fluids discharge. Below is the conceptual model made by Sorey and others that Pribnow uses to make inferences on the structure and flow of the hydrothermal systems in Long Valley Caldera.
Conceptual model of present-day flow field in Long Valley Caldera after Sorey et al. (1991).
The discussion and conclusions in Pribnow’s paper give interpretations on the structure that are strongly based in factual data and observations. Pribnow, like Farrar, Sorey and others, notes that the temperatures measured in the Long Valley Exploratory well are lower than they should be if a magma chamber of 800°C is assumed at 6-8 km beneath the resurgent dome. A possible explanation inferred by geologists is that cooling occurs from the down flow of cold meteoric water. Pribnow acknowledges that this idea is supported by the suggestion of a decrease of hydraulic head with depth when comparing water levels in the Long Valley Exploratory Well with the levels in of the adjacent Santa Fe well. The thought of meteoric down flow up to 3 km is not in agreement with the temperature data Pribnow notes. Pribnow uses a Peclet number analysis of the temperature logs of Long Valley Exploratory Well to infer that convection cells above and below the Bishop Tuff create changes in the temperature gradient. Pribnow continues, saying that a 2000 m deep section of geothermal and hydrothermal activity below the Bishop Tuff is most likely caused by the up flow of formation fluids that may possibly follow a fault zone that is encountered at 2600 m. The thermal data of the lower section of hydrothermal activity shows no indications of down flow of cold fluids Pribnow states. The deep electrical sounding survey done by Pribnow and his team brings them to conclude that the resurgent dome to a depth of 2-2.5 km is not part of the hydrothermal system that is found in the western half of the caldera. Because the results of the electrical sounding are consistent with Sorey’s flow model, Pribnow concludes that there is no evidence of modern day fluid flow in the upper 2 km of the resurgent dome. The final interpretation and assumption made by Pribnow is that the flow system that is alive today is driven by the heat from shallow magmatic intrusions underneath the Inyo Craters and that the fluid bypasses the resurgent dome. He goes on to infer that the temperatures found in the Long Valley Exploratory Well represent the thermal activity of the caldera in the previous episode of hydrothermal activity. Blackwell’s interpretations are in agreement with Pribnow’s and so are Sorey’s. While Blackwell was inferring on the basic structure of the hydrology of the hydrothermal systems, Pribnow and Sorey have gone a step further to explain the specifics and dynamics along with the historical context that makes up the hydrothermal system found today in the caldera.
Conclusion
The work done in Long Valley caldera and specifically focused on the resurgent dome has been a multiple decade long process. Geologists such as Sorey have led the groundwork for both modern observations and interpretations. Thanks to the work of dozens of people, the hydrology of the hydrothermal system is better understood than it has ever been before. But unfortunately this vast and complicated system in this highly active area is full of variables and unknown boundaries. Pribnow and others continue to use new methods of observation with newer technology to try and decipher the exact flow system and structure of the hydrothermal systems in the caldera. While the USGS and others drill to great depths in search of a large bodied magma chamber, others such as Pribnow would argue that it is the shallow flow system they should be focused on. The present day conceptual model for the hydrothermal system is generally agreed upon between Blackwell, Sorey, Pribnow and many others. The fact that the general system as a whole is still not yet fully understood means that more monitoring and exploration need to occur. This is easier said than done. One solution is to make more drill holes in the caldera to monitor more areas and possibly map out the flow system more accurately. Another idea I would suggest is the use of deep electrical sounding once again to look at the conductivity and resistivity of the area around and under the resurgent dome. Pribnow used a 2-D model in their survey which was already a new approach from the 1-D model used in previous electrical sounding surveys. But as Pribnow mentioned, a 3-D model would give more specific detail and understanding of the resistivity and structure of the ground being surveyed. Beyond these two ideas I have I am not sure how else to further discovery and exploration of the caldera. The close monitoring that the USGS and others do today is essential to knowing if the hydrothermal system is changing and if so what that could mean. The hydrology of the hydrothermal systems is a very complicated and obscure thing that is a challenge for scientists to uncover. But knowing exactly what is going on beneath the resurgent dome and caldera is essential to close monitoring and future prospects for the area as a whole. Without further studies into the hydrothermal systems, the Long Valley caldera will remain an unpredictable and volatile area that has the potential to be a productive resource or a ticking time bomb.
references
Blackwell, D. D. (1985). A transient model of the geothermal system of the Long Valley caldera, California. Journal of Geophysical Research: Solid Earth (1978–2012), 90(B13), 11229-11241.
Sorey, M. L., McConnell, V. S., and Roeloffs, E. (2003). Summary of recent research in Long Valley caldera, California. Journal of Volcanology and Geothermal Research, 127(3), 165-173.
Pribnow, D. F., Schütze, C., Hurter, S. J., Flechsig, C., and Sass, J. H. (2003). Fluid flow in the resurgent dome of Long Valley Caldera: implications from thermal data and deep electrical sounding. Journal of Volcanology and Geothermal Research, 127(3), 329-345.
Sorey, M. L. (1985). Evolution and present state of the hydrothermal system in Long Valley caldera. Journal of Geophysical Research: Solid Earth (1978–2012), 90(B13), 11219–11228
Hurwitz, S., Farrar, C. D., and Williams, C. F. (2010). The thermal regime in the resurgent dome of Long Valley Caldera, California: Inferences from precision temperature logs in deep wells. Journal of Volcanology and Geothermal Research, 198(1), 233-24

[Return to Research Projects] [Return to Sierra Home]