Geology and Natural Heritage of the Long Valley Caldera
Volcanic Monitoring in Long Valley, California
Jensen Grimmer
Abstract
Around 760,000 years ago an explosive eruption shook the western United States creating a ten–mile by twenty–mile caldera in the Eastern Sierra Nevada region of California. Now, hundreds of thousands of years later the Long Valley Caldera is once again showing visible signs of activity. The United States Geological Survey (USGS) is constantly monitoring volcanic activity within the United States. This paper specifically focuses on the monitoring of increased volcanic activity in the 1980s but also explains the general means by witch geologist are able to monitor volcanoes. Using tools and instruments such as remote sensing, seismicity measurements, ground deformation, gas, hydrology, and geophysical measurements, scientists predict the odds of a volcanic eruption in the near future. If a volcanic site shows change in any of these categories the USGS will precisely review all data in order to decipher if the volcano is increasing in activity. The primary methods of volcanic monitoring referring to the volcanic activity in the Long Valley Caldera in the 1980s were seismicity and measurements of deformation. In this paper, the different types of monitoring systems that scientists have developed over many years of study will be discussed. Specifically, the events surrounding Long Valley Caldera 1980s volcanic hazard warning will be explored ("How We Monitor Volcanoes").
Introduction
A volcanic eruption rarely occurs without preceding seismic activity. In order for a volcano to erupt, gas and magma must first find their way through narrow fractures underground. The force of this journey will cause low vibrations such as low frequency earthquakes and volcanic tremors. Seismic activity involving active volcanoes is characterized by frequent earthquakes of a magnitude of approximately 3 and lower and shallow depths. The pre–eruption earthquake occurs no more than 10 kilometers below the surface at a frequency of tens to hundreds of times. Because earthquakes preceding volcanic eruptions tend to have low magnitudes, USGS installs four to eight seismometers within 20 kilometers of the volcanoes vent in order to insure as much seismic activity is recorded as possible ("How We Monitor Volcanoes").
Volcanic deformation is measured by means of GPS, tiltmeters, and InSAR. The Global Positioning System, more commonly abbreviated as GPS is a method of volcanic monitoring. GPS uses a system of 24 satellites that transmit radio frequencies to receivers on the ground. However the clocks in the receivers are not atomic like the clocks in the satellites, so slight errors are possible. Volcanic monitoring must be extremely precise because the deformation of a volcano may only be visible by centimeters or less. In order to decrease errors in GPS, USGS places GPS receivers on numerous different physical features of a volcano called benchmarks. This strategy eliminates error. If all the receivers’ GPS coordinates are recorded at the same time, atmospheric conditions will be the same for all benchmarks, canceling any amount of error ("How We Monitor Volcanoes").
Tiltmeters are the oldest devises used in the measurement of volcanic deformation and electronic tiltmeters are the most common method used in all volcanic monitoring. Tiltmeters were commonly used to monitor the Long Valley Caldera in the 1980s. This volcanic monitoring method is used to measure the tilt of the ground surrounding a volcano to provide crucial information about a volcano’s magma chamber. The direction of the tilt will provide a scientist with information about the movement of the chamber. The direction of the tilt will specify if the magma camber is filling up or being emptied out. If a scientist believes a volcano may be close to eruption an electronic tiltmeter is a precise instrument for deformation, proving accurate to .00006 of a degree ("How We Monitor Volcanoes").
Volcanic deformation is also often measured in Electric Distance Meters. USGS places numerous benchmarks on specific locations on a volcano. An electromagnetic wavelength is then sent in between the EDM and the receiver. If the wavelength is off by any measurement some degree of volcanic deformation may have occurred.
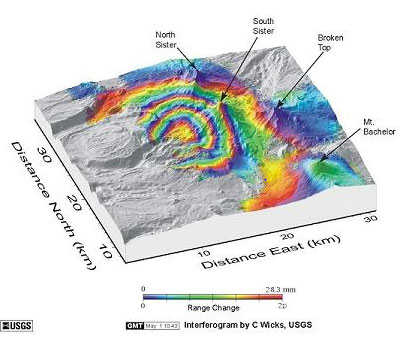
Unavailable at the time preceding the volcanic hazard warning in the Long Valley Caldera was the Interferometric Synthetic Aperture Radar. This method of measurement is commonly abbreviated as InSAR and is a new ground–breaking technology in the field of volcanic deformation measurements. This new remote–sensing technology has made such an impact in science, because it is able to map a complete special representation of a volcano by the accuracy of a centimeter, unlike past tools that could only map the measurements of individual "benchmarks." Below is an example of an InSAR diagram.
http://volcanoes.usgs.gov/activity/methods/insar/index.php
Gases, primarily carbon dioxide and sulfur dioxide are released from fumerals, porous ground surfaces, and vents on active volcanoes. Measuring the release of gas into the atmosphere can provide the USGS with critical information about the activity of a volcano. While this information is extremely useful, it is for the most part too dangerous to collect on a regular basis. In order to collect gas samples a scientist must visit an unpredictable active vent. The vents are also typically on the top of high mountains; subjecting scientist to dangerous helicopter rides and hikes as well as harsh weather conditions ("How We Monitor Volcanoes").
Outside of direct sample measurements, volcanic plumes are studied for emission rates of sulfur dioxide and carbon dioxide by the correlation spectrometer and the infrared analyzer. The emission of sulfur dioxide is measured by the correlation spectrometer. The data collected by this particular instrument is typically gathered by either driving in crisscrosses in a ground vehicle under a plume, a ground tripod, or a small plane or helicopter flying in a crisscross pattern perpendicular and under the plume. Carbon dioxide emissions are measured in a similar way to the infrared analyzer. A small aircraft flies through the plume until a complete cross–section can be analyzed.
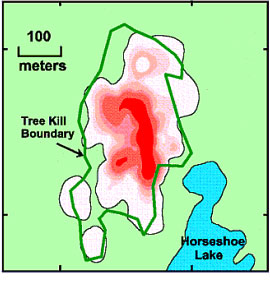
The gas analyzed in soil is also a common tool for monitoring volcanic deformation. CO2 is often released into the soil surrounding an active volcano chamber. A chamber is placed near ground surface that measures the concentration of gas entering the chamber. A prime example of volcanic gas in soil occurred when an increase in carbon dioxide in the nineties killed thousands of tress in the Horseshoe lake region of Mammoth Mountain. Below is a diagram of the area around Horseshoe Lake that was affected by carbon dioxide ("How We Monitor Volcanoes").
. http://volcanoes.usgs.gov/activity/methods/gas/soil.php
Observations
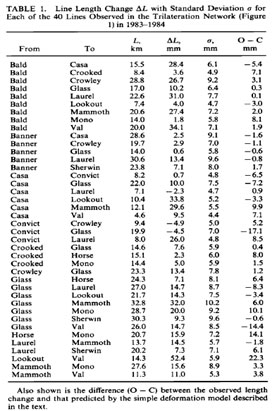
The scholarly article, Deformation in the Long Valley Caldera, California 1983-1984 by J.E Estrem, M. Lisowski, and J.V Savage provides ample evidence for volcanic deformation. Since the 1980 chain of earthquakes in the Mammoth Lakes region of California, the Geological Survey has kept record of deformation of the subsequent area. By process of leveling and trilateration, the USGS set up a network monitoring deformation of the Long Valley Caldera. Data recorded from a Geodolite during July 1983 and again in August 1984 were compared and shown to correlate the inflation of the Long Valley Caldera magma chamber and deformation of the valley (Estrem et al.).
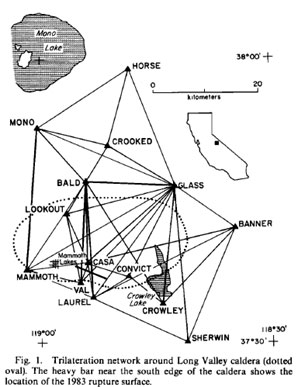
Evidence for this is apparent with data collected for horizontal deformation use; shown below in Figure 1 and Table 1.
Figure 1.The original 40 lines of trilateration are illustrated in Figure 1. In Table 1, the data collected for horizontal deformation is displayed.
Shown above, the horizontal deformation is most apparent between the two benchmarks, Lookout and Val. This line changed by 52 millimeters, and approximately nine out of forty lines changed 25mm or more (Estrem et al.).
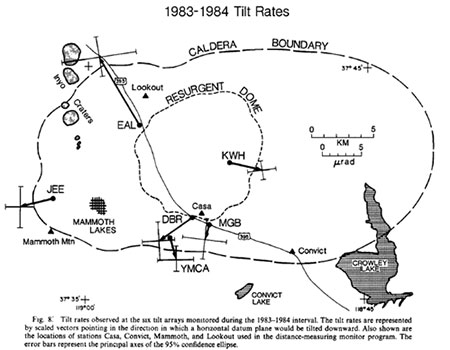
In addition to the horizontal vector displacement records discussed above, the surface of the Long Valley Caldera was also measured for change in horizontal tilt in the 1983-1984 timespan. For these measurements, six locations were used inside the caldera where readings were recorded. These different locations, along with correlating scaled vectors directed at the location of tilt, are displayed in Figure 8 below (Estrem et al.).
Estrem, et. al 1983-1984
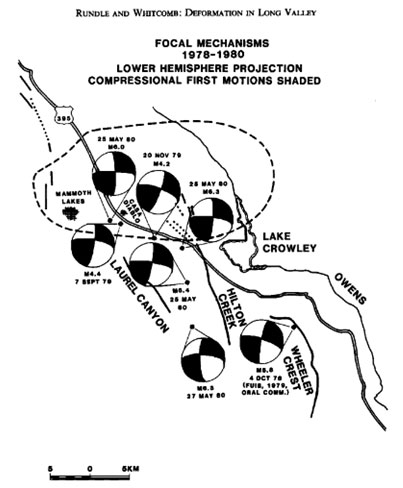
Rundle and Whitcomb [1984] on the other hand, give a more general overview of the volcanic deformation and response to seismology in Long Valley Caldera in the 1980-1983 volcanic activities. In the map below, the main faults along with their respective focal points for activity associated with the biggest seismic events from 1978 to 1980 are shown:
This map gives a broad view of the Long Valley deformational and seismic activity between the years 1978-1980. From Rundle and Whitcomb’s data, interpretations are made in the below section (Rundle et al).
Interpretations
Geologists and geophysicists alike have used tools of volcanic monitoring to determine to the best of their ability the reasons for the span of increased volcanic and seismic activity that occurred around the 1980s. In general, the many scientists who have studied the events in the late 1970s and early 1980s agree that an increased flow of magma under the long valley caldera induced seismic activity.
By use of different monitoring tools such as leveling measurements, horizontal strain, and seismicity data, interpretations of the period researchers such as Rundle and Whitcomb were able to postulate their own interpretations through means of volcanic monitoring. A trend of uplift along with strain, cohere with the chain of earthquakes that took place during this time. Factoring in volcanic monitoring tools, the data showed that a body of magma was rising with subsequent seismic activity. Also, by use of complex calculations, the two geologists were able to estimate the amount of inflation that could occur before rock layers above the magma would fracture and fail. At the time of the study, Rundle and Whitcomb concluded that failure would occur when the magma chamber reached a depth of shallower than 3km (Rundle et al).
Data collected from Lisowski, Estrem, and Savage on the monitoring of Long Valley correlate with the previously mentioned work. It can be said that both scholarly papers believe that a strong increase in seismic activity of the area was caused by volcanic induction of magma beneath the ground. The changes in lines from the trilateration network were interpreted as evidence for movement within a magma chamber. The sum of the squares from four of the points in the trilateration suggested that the change was "symmetrically directed radically outward from the caldera." This mathematical calculation is interpreted as proof for deformation in a roughly circular motion, meaning a movement in the magma chamber, a roughly spherical geologic feature. The results from the electronic tiltmeter used on the lines Casa to Convict and Mammoth and Lookout came out to be approximately a 5 millimeter change. This was plenty proof enough for Estrem, Lisoski, and Savage to add to the evidence of expansion in the magma chamber in the Long Valley Caldera (Estrem et al.).
Conclusion
While scientist such as the researchers mentioned above found ample evidence suggesting an eruption in the 1980s, it is simply impossible to predict the exact date and time an eruption may occur. This pressure on scientists to know everything about a natural event has taken place long before 1980s but the announcement that the volcano was in fact very active created quite the controversy in the Eastern Sierras. Scientists in Long Valley now struggle with the decision to notify the public about potential volcanic hazards. How many warning signs does it take to grow weary of a potential natural disaster? How do scientists balance their personal knowledge and the effects their observations may have on the public? It is impossible to know exactly when a volcano may erupt, but because of volcanic monitoring geologist can make a rough estimate. In the 1980s federal geologists put up the lowest alert level available, the potential hazard warning. This warning however, had a huge impact on the local economy that is primarily dependent on tourism. The prices of houses in the area fell forty percent in one night following the announcement. The local economy was in an uproar. The geologists however had plenty of reason to believe there was in fact a potential risk: in 1980 there were four magnitude 6 earthquakes and the lava dome in the Long Valley caldera rose 10 inches in one year. Earthquakes and deformation continued visibly until 1983, but when the volcano did not erupt, instead of being thankful, locals focused all of their frustration from the low economic years on the scientists. This public backlash dramatically hurt the trust between the public interest and geological information. Geologists now must be extremely careful when warning the public, but is it fair for scientists to withhold information from the public because it may have a negative effect on the economy? The science community must decide if it is in the public interest to warn of potential harm or if they will lose the trust of the public and not have the same authority when a real disaster occurs (Blakeslee).
Works Cited
Blakeslee, Sandra. "Wrong Once, Experts Keep Quiet On Volcanic Activity in California." The New York Times. The New York Times, 11 Sept. 1990. Web. 11 June 2013
Estrem, J. E., Lisowski, M., and Savage, J. C. (1985). Deformation in the Long Valley Caldera, California, 1983–1984. Journal of Geophysical Research, 90, 12–12,690. DOI
"How We Monitor Volcanoes." How We Monitor Volcanoes. N.p., n.d. USGS. 11 June 2013.
Rundle, J. B., and Whitcomb, J. H. (1984). A model for deformation in Long Valley, California, 1980–1983. Journal of Geophysical Research, 89, 9371–9380. DOI
[Return to Research Projects] [Return to Sierra Home]