Geology and Natural Heritage of the Long Valley Caldera
Volcanic Monitoring and Response
within the Long Valley Caldera
Bryan Wathen
Abstract
The Long Valley Caldera was produced by a massive eruption less than 1 million years ago. Current unrest has been ongoing for the past several decades and has included at least one false alarm. The United States Geological Survey has put in volcanic monitoring systems within the Long Valley Caldera. This includes high tech equipment that can continually monitor the seismic activity, ground deformation and off–gassing. The U.S.G.S. has also implemented a warning system that uses set criteria to classify the level of current activity.
Introduction
The Long Valley Caldera lies on the eastern edge of the Sierra Nevada Range, northwest of Owens Valley, and to the west of the White Mountains. In recent years unrest within and around the caldera has been witnessed and measured by an array of monitoring tools. These tools are critical to assessing the condition of the volcano. The goal in mind is to provide the most accurate data that can then be used to classify the level of activity. This classification system takes into consideration all factors including human life, social and economic loss. Throughout we will briefly discuss the geologic history of the caldera and its current unrest, the systems in place to monitor the activity, and the classification of the activity by set criteria.
1. Volcanic History of the Long Valley Caldera
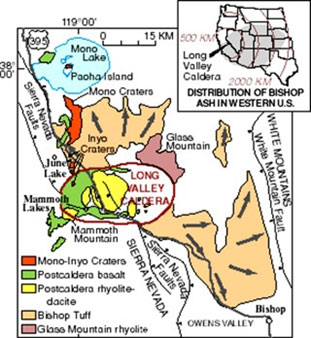
Figure 1: Map of Long Valley Caldera Region (Hill D. , 2008)
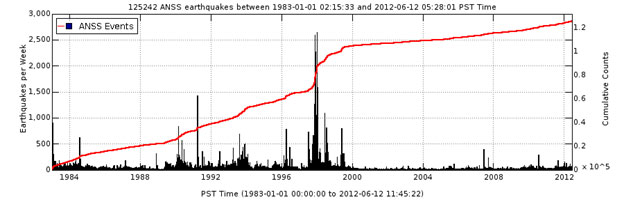
Figure 2: The vertical bars on the graphs below correspond with the left-side y-axis and represent the number of earthquakes per day. The red line indicates the cumulative number of earthquakes and corresponds with the right–side y–axis. (U.S. Geological Survey, 2012)
The formation of the Long Valley Caldera occurred 760,000 years B.P. following an enormous eruption that released over 600 km3 of lava that formed the Bishop Tuff. Once this massive amount of material emptied, or at least partially emptied, the magma chamber, a ring fault developed that allowed for the overlying crustal block to descend and form an elliptical caldera that is 17 km north to south by 32 km east to west in size (Bailey, 1976). In the subsequent 100,000 years resurgent doming developed in the western central area within the caldera as the remaining magma under the surface ascended upward (Hill D., 2006). The ring fracture that developed from the collapsing caldera led to lava flow vents on the southwest edge of the rim causing the formation of a volcanic dome complex called Mammoth Mountain between 110,000 and 56,000 years B.P. (Bailey, 1976). According to Bailey (1976) the most recent of volcanic features seen within Long Valley are the Mono - Inyo craters and domes that run in a northward direction following a linear fracture in the western margin of the caldera. This line of domes and craters occurred as long ago as 40,000 years B.P. in the south and as recent a 250 years B.P. in the north as they extent into the Mono Basin.
2. Recent Unrest
While these new volcanic structures have been seen in very recent geologic history none have produced major destructive power. However, recent unrest within and around the caldera has been seen. Large magnitude earthquakes started to be recorded in 1978 with one that measured 5.8 in magnitude. Shortly thereafter in 1980 and throughout the decade a sequence of earthquakes occurred that included many that measured greater than magnitude 6. With this ground shaking activity came almost 40cm of resurgent dome uplift (Hill D., 2006). Once again starting in early 1990 earthquakes returned as well as new activity in the form of off-gassing around the Mammoth Mountain area that resulted in an area of trees dying due to an enormous amount of CO2 being released from under the surface of the earth. More unrest was felt in 1997-1998 as strong earthquakes emanated for the southern rim of the caldera near Convict Lake.
3. Volcanic Monitoring
The scores of volcanoes around the world that have erupted and consequently taken the lives of many and caused enormous amounts of property damage have shown that there is a need to better understand the processes involved under the surface which facilitate such destructive forces. In order to clearly identify potential hazards and threats scientists set forth with many tools to use, ranging from that of written record from previous volcanoes to high-tech satellite imaging.
3.1 Seismic
Magma within the crust that is driven by thermal processes seeks to squeeze through areas of least resistance such as cracks and fractures. If such cracks do not exist it can push on the surrounding rock to create fractures or simply displace it (Francis and Oppenheimer, 2004). This movement of magma creates seismic waves that maybe too small to be felt by people but can be felt and measured by seismometers. These extremely sensitive seismometers are typically deployed in arrays which allow for both measuring the magnitude and for the pinpointing of where the seismic activity originated from.
As seen earlier the number and magnitude of seismic events can provide a great deal of useful information regarding the current state of volcanic activity. The initial signs of unrest are volcanic earthquakes. These are markedly different from tectonic earthquakes in that they originate at shallower depths, less than 10 km, and are generally weak with magnitudes less than 3. These earthquakes also occur in swarms located under the volcano. At times continuous volcanic tremor can occur that produces seismic activity that is persistent for some time (U.S. Geological Survey, 2012).
The activity seen within Long Valley over the past decades show all the characteristics of magmatic movement within the crust just below the surface (Hill D. , 2006). This seismic activity seen at Long Valley is monitored by 61 seismometers throughout the area (U.S. Geological Survey, 2012).
3.2 Ground Deformation
As magma moves upward it must find a place to go. In doing so visible deformation of the surface may be present as the magma displaces the overlying rock. This was seen within Long Valley as the resurgent dome inflated and lifted upward several times in the past few decades. In order to measure this scientists are able to employ several techniques that include differential leveling, electronic tiltmeters, Global Positioning System satellites, and radar interferometry. Differential leveling may be used to measure large amounts of displacement but require set benchmarks that a team must return to on several occasions and take measurements that are time consuming with limited accuracy, as well as extremely hazardous. Electronic tiltmeters can be extremely accurate and offer the benefit of being emplaced at a location long term and then can be monitored remotely. Radar interferometry is now being used with great accuracy. With this system radar satellites measure the time it take for microwaves to bounce off the surface of an object, in this case the earth, and return to the source. Radar interferometry has many advantages including nearly instantaneous readings that display large areas and all weather operation night or day. However, it does have its draw backs as there is no dedicated satellite to each area it is needed which means real time continuous monitoring cannot be done (Francis and Oppenheimer, 2004). GPS is also becoming an extremely accurate way to continually monitor surface deformation. With a system of 24 satellites orbiting the Earth, GPS is able to provide precision of 3mm horizontally and 8 mm vertically. Currently the USGS and others have 9 tiltmeters and 46 GPS receivers monitoring for surface changes within Long Valley (U.S. Geological Survey, 2012).
3.3 Gas Emissions
The composition of magma, the pressure at which it is confined, and its current temperature all play a role in the amount of volatiles which it can hold in solution. These volatiles, which include CO2, SO2, H2S, and CO gases, may come out of solution if any of the above change. Scientists may use the presence of these gases to paint a picture of what is happening below the surface. For instance, we discussed earlier about the CO2 off–gassing that occurred in the Mammoth Mountain area. This can give leads to the condition of the magma below. CO2 has a relatively low solubility in melt meaning that it takes great pressure to contain it within a solution. If CO2 is present on the surface it may indicate that a new intrusion of magma is present and has ascended to the point which CO2 is exsovled from solution (Francis and Oppenheimer, 2004). Used in conjunction with CO2, SO2 can be measured to assess the volcanic condition. SO2 has a much lower point of solubility in melt, meaning that if the pressure continues to lower it will begin its journey to the surface following the same path the CO2 traveled. So, if there is an increase in the amount SO2 present and a decrease in the CO2 to SO2 ratio this may indicate an ascent of magma close to the surface (Francis and Oppenheimer, 2004).
3.4 Thermal Monitoring
The measure of thermal output at the surface can also help to provide valuable data when assessing a volcanic threat. The extreme heat of magma may interact with ground water sources. These interactions may be seen in the numerous hot springs located throughout Long Valley. Logic tells us that an increase in hydrothermal activity near the surface may indicate magma coming in closer contact to the water source. However a decrease in thermal activity and temperature may also be a bad sign. If the channels that allow for these processes to take place are sealed off, large amounts of pressure may begin to build and increase the likelihood of an explosive eruption (Francis and Oppenheimer, 2004).
While the hot springs are nice and warm, not all water – magma contact can produce enjoyable outcomes. The Inyo craters mentioned earlier area a result of direct contact between magma and ground water. This contact can produce a very violent reaction as the water turns to vapor a quickly becomes highly pressurized underground. In very rapid succession this pressure will be released in an explosive phreatic eruption (U.S. Geological Survey, 2012).
3.5 Other Methods of Monitoring
The previous methods discussed are most common; however others do exist that may or may not have applications within Long Valley. Acoustic monitoring can be used to record audio frequencies that volcanoes put off. Gravimetry may also help to track magmatic movement within the crust. As the magma moves it causes subtle changes in the gravitational field due to mass distribution. Electromagnetic disturbances may also allow for measurement and assessment. Changes in temperature, pressure and chemistry may produce electrokinetic fields that are produced by displacement of water molecules and mineral grains (Francis and Oppenheimer, 2004).
4. Assessing the Threat of the Long Valley Caldera
After all data is collected and compiled scientists can begin to assess the current condition of the volcano and determine if a threat is present. In order to do so many considerations must be taken, including the social and economic impact that will proceed. Obviously the major goal for all involved is public safety and minimizing damage if a volcanic eruption does occur. However, economic damage can occur if warnings are sent but no eruption takes place. This was seen in the earthquake swarms that took place under Mammoth Mountain in 1989. Concern was raised about the condition of the volcano prompting many to assume that an eruption was probable. As a result of this false alarm the tourist industry, which is the main contributor to the local economy, was temporarily arrested. The housing market was subsequently affected as many residents and perspective residents felt it undesirable to live in an area with an eruption possibly present (Hill, et al., 2002). False alarms like these not only can produce societal and economic damage to the area that may take years to recover but can also hinder the credibility of the scientific community responsible for the alert making it less likely to heard if a threat arises again (Tilling, 2008).
4.1 Criteria
The U.S.G.S (Hill, et al., 2002) has put together a set of criteria that help to determine the threat level and the need to activate the emergency response plan. These criteria were developed based on scientific research and data collected from past eruptions around the world. These criteria include seismic events and discerning if these seismic events relate to magmatic movement close to the surface or simply every activity deep within the crust. Crustal deformation guidelines are set in place as well. As we noted earlier, in the 1980s almost 40 cm of uplift occurred on the resurgent dome, yet no eruption took place. Guidelines within the response plan outline rates and magnitude of crustal deformation that are cause for alarm initiation of the warning system. CO2 emissions also have set criteria to help determine if a real threat is present.
4.2 Identifying the condition and activating the proper response
The U.S.G.S. has implemented and four-tiered alert system that is based on data collected and the current volcanic threat. Once the data is interpreted and set against the criteria mentioned above a determination can be made about which condition the threat can be classified.
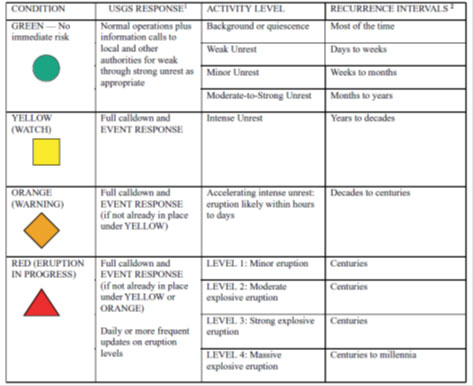
Figure 3: Summary of condition classification. (Hill, et al., 2002)
Once classified the proper response can be initiated. GREEN shows that there is no immediate risk and normal operation may resume. If intent unrest is monitored the YELLOW (watch) status may be put into effect and very close monitoring will continue as well as a ready status to initiate the warning condition if intense unrest escalates. ORANGE (warning) Condition is characterized by more intense geologic behavior but with the same U.S.G.S. response, however, local event response will be put into effect as the likelihood of an eruption within the following days is high. If the volcano does actively erupt Condition RED will be called. Condition RED is further broken down based on the level of eruption intensity (Hill, et al., 2002). This classification system was set in place to function as a notification system that allows residents, government officials, scientists, aviators, and travelers to be aware of the current threat level.
5. Conclusion
With the recent unrest within and around the Long Valley Caldera it is of great importance to continually monitor and reassess its condition. Doing so requires an array of high tech equipment that can retrieve data in real time. Human life is not only at stake, but social and economic issues also arise in response to volcanic activity. The system in place by the U.S.G.S sets forth to ensure all parties involved are making rational decisions based on facts and empirical data. However, some areas of classification are open to interpretation. Sensitivity must be used when considering declaring a higher hazard level.
Works Cited
Bailey, R. (1976, February). Volcanism, Structure, and Geochronology of Long Valley Caldera, Mono County, California. Journal of Geophysical Research, 81(5), 725–744.
Francis, P., and Oppenheimer, C. (2004). Volcanoes. Oxford: Oxford UniversityPress.
Hill, D. (2006). Unrest in Long Valley Caldera, California 1978–2004. In C. Troise, G. De Natale, and C. Kilburn, Mechanisms of Avtivity and Unrest at Large Calderas (Special Publication 269 ed., pp. 1–24). London: Geological Society.
Hill, D. (2008). Bulletin of the Global Volcanism Network. Retrieved from Global Volcanism Program: website
Hill, D., Dzurisin, D., Ellsworth, W., Endo, E., Galloway, D., and Gerlach, T. (2002). Response Plan for Volcano Hazards in the Long Valley. Denver: U.S. Geological Survey.
Tilling, R. (2008). The critical role of volcano monitoring in risk reduction. Advances in Geosciences, 14, 3-11.
U.S. Geological Survey. (2012). Long Valley Caldera. Retrieved from USGS Volcano Hazards Program: website