Geology and Natural Heritage of the Long Valley Caldera
Monitoring Volcanoes in the Eastern Sierra Nevada: The Methods and Their Use for Predicting Future Eruptions
Lindsay Martin
Abstract
Monitoring volcanoes is important in the Eastern Sierra Nevada because of the continuous signs of volcanic unrest in the area. There are many methods used to monitor volcanoes including detecting crustal deformation, monitoring seismic activity, measuring gas emissions, and studying hydrothermal systems. By combining all the data from these monitoring methods and comparing it with data from previous eruptions, it is possible to predict future eruptions. In order to protect and inform the public of varying degrees of volcanic unrest, the United States Geological Survey (USGS) has implemented a response plan specific to the Long Valley region [Hill et al., 2002]. It is crucial to continue monitoring volcanic activity and advancing the monitoring technologies for the purpose of reducing the potential impact of an eruption and contributing data and resources to volcanic observatories and programs.
Introduction: Volcanic History of the Eastern Sierra Nevada
The Eastern Sierra Nevada has a long volcanic history. The oldest volcanic rocks from the area are believed to have erupted between 28 and 8 million years ago, and the most recent volcanic activity began with the Long Valley Eruption about 760,000 years ago. The ash fall from this massive eruption can be detected as far west as offshore of Los Angeles and as east as Nebraska (see Figure 1). The area surrounding the Long Valley was inundated with ash fall and ash flow known which forms the Bishop Tuff. After the eruption, the empty magma chamber collapsed and left an oval depression known as the Long Valley Caldera that measures about 15 x 30 kilometers [Tierney, 2000].
After the Long Valley Eruption, volcanism continued to occur in the Eastern Sierra Nevada. Eruptions occurred at irregular intervals on the caldera floor and, magma rising in the floor of the caldera created a resurgent dome. Mammoth Mountain began eruption about 150,000 years ago. For 100,000 years the mountain produced an eruption every 5,000 years, and although the volcano has been dormant for 50,000 years, it is most likely not extinct [Harris, 1988].
North of Mammoth Mountain, activity began at the Mono-Inyo Craters about 40,000 years ago until about 600 years ago. The craters and domes run from the northwest of the Long Valley Caldera northward to Mono Lake. The most recent eruptions from this chain occurred in Mono Lake on Paoha Island about 250 years ago. The Mono Craters were characterized by explosive eruptions that created a crater and then extrusions of very viscous magma that created a lava dome. Panum Crater is an excellent example of this landform. The Inyo Craters were characterized by very explosive phreatic eruptions followed by smaller ash plumes and lava flows [Harris, 1988].
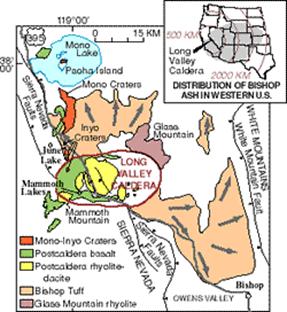
Figure 1. Geological Map of the Long Valley and Mono Lake Region. Figure reproduced from USGS Long Valley website [2009].Even though the Eastern Sierra Nevada has been quiet for about 250 years, it is still a possible site for a future eruption. In 1980, the caldera showed signs that it was going to erupt. Four magnitude-6.0 earthquakes occurred over 48 hours accompanied by hundreds of small earthquakes. Researchers found that the resurgent dome had elevated ten inches since 1978. The swarms of small earthquakes continued, and researchers believed that they were shallow, indicating that magma was moving closer to the Earth’s surface. The USGS announced a low level volcanic alert. This shocked many of the residents and tourists because many did not realize they were living in an active volcanic area. The local economy was destroyed. Tourists stopped travelling to the area, and no one wanted to buy property anymore. When nothing happened the local people were outraged.
Another scare occurred in late 1997 when there was a swarm of large earthquakes, and the resurgent dome grew four inches in a six-month period. Because of these periods of unrest, the monitoring of volcanic activity has intensified [Wheeler, 2000]. The USGS uses seismology, measures gas emissions, studies the hydrological processes of the area, and continues to measure the crustal deformation in the resurgent dome and other areas in order to monitor volcanic activity.
Methods Used to Monitor Volcanoes in the Eastern Sierra Nevada
1. Crustal Deformation
The Earth’s surface moves frequently around active faults, and earthquakes can trigger this movement. The surface of the ground also deforms as a result of volcanic activity. Because the Long Valley area is near the Basin and Range Province and the San Andreas Fault, there is a lot of faulting and fracturing in the Earth’s crust. Measuring the crustal deformation plays an important role in monitoring volcanic activity. There are many ways to measure crustal deformation including GPS, tiltmeters, leveling, and InSAR.The Global Positioning System (GPS) is one of the major ways to monitor ground deformation in the Long Valley Caldera and surrounding area. GPS uses satellites in space in order to calculate the receiver’s position on the Earth’s surface. There are currently 24 GPS satellites orbiting in space, and a GPS receiver is able to see at least four at all times. Through these four satellites, the receiver can almost accurately measure its position, and differential GPS (DPGS) is used in order calculate the error in the GPS. In order to monitor crustal deformation two locations are measured again and again to detect changes in height. [Brain and Harris, 2009].
Tiltmeters can measure the ground tilt caused by earthquakes and volcanic uplift. Surveyors can measure the precision of the tilt to less than one inch in 16,000 miles. In order to avoid measuring false tilting, tiltmeters are inserted in boreholes. The tiltmeters used in boreholes operate with a liquid level system or a bubble under concave quartz. Differential capacitance transducers and linear voltage differential transformers are used to measure height change of the two ends of the liquid level system [USGS Earthquake Hazard Program website, 2009].
Leveling is another important way that crustal deformation is monitored. Surveyors measure the relative height difference between two points known as benchmarks. The benchmarks are measured again, and the data is used to calculate the elevation change over time. The surveys can be done two different ways. One way is by long traverses, which covers an area of over ten kilometer and allows surveyors to measure vertical displacement relative to a distant stable benchmark. The second way is by short traverses, which covers an area of less than one kilometer. Short traverses are usually used to measure local ground tilt [Dzurisin, 1992].
Interferometric synthetic aperture radar (InSAR) is one of the newest technologies used to measure crustal deformation. The images produced by InSAR can show the ground displacements as a result of earthquakes and volcanoes. InSAR is a remote sensing technique that uses radar satellite images to detect deformation. This system uses two radar images taken at different times (see Figure 2). The differences in the images can detect the crustal deformation [Helz, 2005]. The advantage of InSAR is that it can determine crustal deformation in hazardous areas without having to put surveying crews in danger [USGS –VHP InSAR Research Group website, 2008].
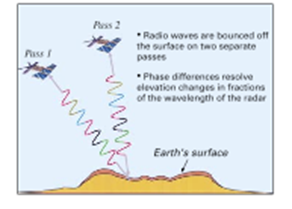
Figure 2. Diagram showing how InSAR works. Figure reproduced from Helz [2005].2. Seismicity
An increase in seismic activity almost always occurs before a volcanic eruption because magma moving up through the Earth causes rocks to crack and vibrate. Thus, it is very important to monitor seismic activity around active volcanoes. Because volcanic-related earthquakes tend to have a very small magnitude, seismic activity is measured close to the volcano. Measuring tectonic earthquakes near volcanoes can be useful because it is possible that an earthquake can trigger the eruption of a volcano [USGS Volcanic Hazards Program website, 2009].A seismometer is the instrument used to measure vibrations in the ground. The USGS usually places four to eight seismometers within 20 kilometers of a volcano in order measure the seismic activity, and a couple are usually placed it. The seismometer creates a seismograph that records the seismic activity. Based on the seismograph, seismologists can interpret the type of seismic behavior happening [USGS Volcanic Hazards Program website, 2009].
3. Gas Emissions
Monitoring gas emissions is a key component of monitoring volcanic activity. As magma moves to the surface, gas dissolves out of it and finds its way out of the ground through fractures, faults, and vents. Scientists are interested in measuring the rate at which gas is emitted and the type of gas emitted. Therefore, samples are taken of the gases for laboratory analysis, and gas emissions are continuously monitored. Chemical sensors can continuously detect concentrations of gas and send data to an analysis center [USGS Volcanic Hazards website, 2009].4. Hydrothermal Activity
Because of the magma bodies that exist underneath Earth’s surface, there is hydrothermal activity in the Eastern Sierra Nevada such as fumaroles and hot springs. Monitoring the hydrothermal activity is important when monitoring volcanoes because changes in the system may indicate volcanic unrest. Certain chemical concentrations in the water such as chloride and hydrogen sulfide and temperature are measured in hydrothermally active areas (see Figure 3). In places such as Hot Creek in the Long Valley Caldera it is common to have rapid temperature changes and geyseringwhen a fracture in the Earth occurs or when one closes up [Farrar et al., 2007].
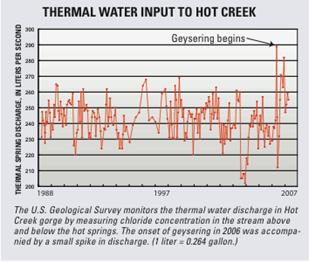
Figure 3. Graph of thermal water input to Hot Creek. Figure Reproduced from Farrar et al. [2007].Analyzing the Data to Predict Future Eruptions
The Long Valley Observatory (LVO) and four other observatories in the United States work together in order to monitor and advance the understanding of volcanic processes. It is important that all of the observatories work together and share data in order to effectively be able to predict eruptions. By using data from previous volcanic eruptions, scientists can better predict future eruptions.
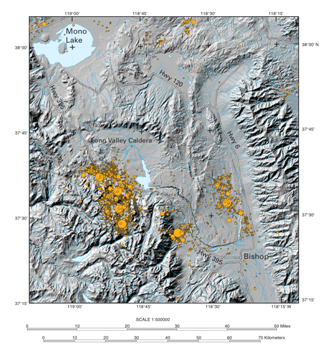
Data collected through measuring crustal deformation in the Long Valley Caldera has shown that the resurgent dome is rising about one inch a year and has risen a total of 80 centimeters since 1978. Because the seismic activity is concentrated in certain areas of the Long Valley Caldera, researchers have detected that there is a shallow intrusion of magma underneath the resurgent dome and a deeper intrusion beneath the South Moat of the caldera (see Figure 4) [Sorey et al., 2003].
Figure 4. Epicenters of earthquakes of magnitude greater than 3 in the Long Valley Caldera. Circle sizes represent the magnitude of the earthquakes. Figure reproduced from Hill et al. [2002].A period of volcanic unrest underneath Mammoth Mountain occurred in 1989. Small earthquakes occurred for most of that year. The next year, U.S. Forest Rangers noticed that near Horseshoe Lake there were areas of tree kill, and investigation of these areas showed that the trees were being killed by gas emissions of carbon dioxide. Several other areas around Mammoth Mountain and the Long Valley Caldera are affected by these gas emissions. However according to Sorey et al. [1998], the periods of seismic activity and the emission of carbon dioxide around the mountain does not necessarily mean that there is going to be a future eruption from Mammoth Mountain. If there were to be an eruption there would be shallower seismicity and crustal deformation. Both of these forms of volcanic unrest are currently absent on Mammoth Mountain. Thus, it is possible that the emissions are coming from an ancient reservoir of carbon dioxide [Sorey et al., 1998].
It is very important to monitor volcanic activity not only to be able to predict eruptions but in order to ensure the safety of the people who live around the volcanoes. In the case of the gas emissions, it is crucial to monitor where and how much gas is emitted because carbon dioxide is invisible but dangerous. The hydrothermal system present in the Long Valley area can also be dangerous. Several people have died from the extreme heat of the water in Hot Creek. Thus, precautions must be taken when allowing the public to swim there or in any other hot spring [USGS Hot Creek fact sheet, 2007].
Figure 5. Response plan to unrest in the Long Valley area. Figure reproduced from Hill et al. [2002].
In order to protect and inform the public, the USGS has implemented the Volcanic Hazards Program. The program works to monitor volcanic activity, analyze the data, and assess the risks. In the case of an eruption, the program also teams together with disaster relief programs to assist the public. The USGS has created a response plan to inform the public in periods of unrest or possible eruptions. There are four conditions in the response plan each indicating the likelihood of an eruption. The requirements for the conditions are based off of the previous history in the Long Valley area and other calderas and areas of similar volcanic activity [Hill et al., 2002]. Figure 5 explains the four different colors and their meanings.
Conclusion: Possible Future Eruptions in the Eastern Sierra Nevada
One of the most common question people have is what the probability of an eruption is in the Eastern Sierra Nevada. By looking at the volcanic history of the area, geologists believe that there will be another eruption [Hill et al., 1998]. However, on the human timescale, geological processes happen very slowly. Thus, it is possible for a future eruption to occur decades or even centuries later. In the past explosive and effusive eruptions have occurred, and according to Hill et al. [1998], the next eruption will be similar to the ones of the Mono-Inyo chain. These eruptions are smaller but explosive. First, there is usually a phreatic phase, and the steam throws debris in the air creating a crater. Next, magma can reach the surface of the vent, and the gases trapped in the magma are dissolved out of solution creating an explosive eruption. Products of this type of volcanic eruption include ash fall and pyroclastic flow. Both are very hazardous to humans. Ash fall can disrupt air travel, while other utilities and pyroclastic flow can destroy anything in its path. It is also dangerous if there is an eruption in the winter because the interaction of magma and the snow could create mudflows and flooding. Effusive eruptions pose less threat to humans but could still damage buildings and other property [Hill et al., 1998].
Therefore, it is very important for the USGS to continue monitoring the area. Monitoring can be very expensive but the lives and property that can be saved seem to make it a good investment. For example, the Philippines’s Mount Pinatubo erupted in 1991, and the total cost of monitoring the volcanic activity was about 56 million dollars. Because of the successful forecasting of the eruption the loss of about 250 million dollars in property value was prevented. The data and experience collected can also be very valuable for other observatories [Newhall et al., 2005]. One disadvantage of the system is if there were to be a false alarm. This happened in the Long Valley area in the early 1980s, and it was devastating to the local economy, which relied on tourism. Because the USGS issued a low level alert, tourists were afraid to visit the area. Also no one wanted to move or buy property around this region. Thus, everyone’s income decreased, the area was no longer economically profitable, and the local people lost their trust in the USGS.
Therefore, the USGS must take every precaution before issuing a warning. Now, people are more educated about the volcanically active area, and the USGS has improved their response plan and communication [Wheeler, 2000].
Due to the continuous volcanic activity in the Eastern Sierra Nevada, the USGS continues to intensify their monitoring of the area’s crustal deformation, seismicity, gas emissions, and hydrothermal processes. Through combining data from multiple observatories and previous volcanic activity, scientists can better predict future eruptions. The USGS response plan for volcanic hazards in the Long Valley area thus uses a range of monitoring data to inform and warn the public about any possible eruptions.
Works Cited
Brain, Marshall, and Tom Harris. "How GPS Receivers Work." Howstuffworks "Electronics" Discovery. Web. 9 June 2010.
<http://electronics.howstuffworks.com/gadgets/travel/gps4.htm>.
Dzurisin, D., 1992, Geodetic leveling as a tool for studying restless volcanoes and their surroundings, in Ewert, J., and Swanson, D.A., eds., Monitoring volcanoes: Techniques and strategies used by the staff of the Cascades Volcano Observatory, 1980 90: U.S. Geological Survey Bulletin 1966, Chapter 12, p. 125-134.
Farrar, Christopher D. et al.“ Boiling Water at Hot Creek—The Dangerous and Dynamic Thermal Springs in California’s Long Valley Caldera.” USGS Fact Sheet 2007-3045. 2007.
"Geologic History of the Long Valley Caldera and Mono-Inyo Craters Volcanic Chain." Long Valley Observatory. USGS, 9 Oct. 2009. Web. 8 June 2010. <http://volcanoes.usgs.gov/lvo/about/history.php>.Harris, Stephen L. Fire Mountains of the West: the Cascade and Mono Lake Volcanoes. Missoula, MT: Mountain Pub., 1988. Print.
Hill et al. “Future Eruptions in California’s Long Valley Area—What’s Likely?” USGS Fact Sheet-073-97. 1998.
Hill et al. “Repsonse Plan for Volcano Hazards in the Long Valley Caldera and Mono Craters Region California.” USGS Bulletin 2185. 2002.
Helz, Rosalind L. “Monitoring Ground Deformation from Space.” USGS Fact Sheet 2005-3025. 2005
"Monitoring Instruments." USGS Earthquake Hazards Program. USGS, 3 Nov. 2009. Web. 9 June 2010. <http://earthquake.usgs.gov/monitoring/deformation/data/instruments.php>.
"Monitoring Volcanic Gases." USGS Volcanic Hazards Program. USGS, 29 Dec. 2009. Web. 9 June 2010. <http://volcanoes.usgs.gov/activity/methods/gas/index.php>.
"Monitoring Volcano Seismicity." USGS Volcanic Hazards Program. USGS, 29 Dec. 2009. Web. 9 June 2010. <http://volcanoes.usgs.gov/activity/methods/seismic/index.php>.
Newhall, Chris, James W. Hendley II, and Peter H. Stauffer. “Benefits of Volcano Monitoring Far Outweigh Costs—The Case of Mount Pinatubo.” USGS Fact Sheet 115-97. 2005.
Sorey, Michael L. et al. "Carbon Dioxide and Helium Emissions from a Reservoir of Magmatic Gas beneath Mammoth Mountain, California." Journal of Geophysical Research 103.B7 (1998): 15,303-5,323. Georef. Web. 10 June 2010.
Sorey, Michael L., Vicki Sue McConnell, and Evelyn Roeloffs. "Summary of Recent Research in Long Valley Caldera, California." Journal of Volcanology and Geothermal Research 127.3-4 (2003): 165-73. Georef. Web. 10 June 2010.
Tierney, Timothy. Geology of the Mono Basin. Lee Vining, Calif.: Mono Lake Committee, Kutsavi, 2000. Print.
"USGS- VHP InSAR Research Group." USGS-VHP InSAR Research Group. USGS, 10 Sept. 2008. Web. 9 June 2010. <http://volcanoes.usgs.gov/insar/>.
Wheeler, Mark. "When Magma's On the Move." Smithsonian.com. Smithsonian, Feb. 2000. Web. 8 June 2010. <http://www.smithsonianmag.com/science-nature/magma-abstract.html>