Geology and Natural Heritage of the Long Valley Caldera
Show Me The Magma!
An introduction to geophysical and geodetic techniques for locating and describing subsurface magma bodies and their applications to Long Valley Caldera, Eastern California.
Abstract
Numerous and varied geophysical and geodetic techniques all evidence the existence of a large body of magma underneath the Long Valley Caldera. There is consensus that this body is located roughly underneath the resurgent dome near the center of the Caldera. More recent evidence from deformation and gravity changes suggests that the body of magma is a tilted prolate spheroid. The uplift of the resurgent dome of roughly 80 cm since the late 1970s, as well as microgravity increases near the dome points to the probability that a large amount of magma was emplaced during the increased seismic activity of the early 1980s.
BRIEF HISTORY OF VOLCANISM IN LONG VALLEY CALDERA
The Long Valley Caldera has a long and complex history of volcanism, beginning with the super-explosive Long Valley eruption, which formed the caldera itself 760,000 years ago. This eruption evacuated about 600 cubic km of magma from an underground magma chamber, causing collapse of the overlying crust, forming the caldera (USGS Long Valley Observatory website, 2009). One might think that such a large eruption might deplete the potential of the area to erupt again. However, nothing could be farther from the truth. Beginning 400,000 years ago, eruptions have taken place in the Mono-Inyo Craters chain, including Mammoth Mountain, and stretching north of the Caldera to Mono Lake, where Paoha Island was formed by an eruption under the lake just 300 years ago (USGS Long Valley Observatory website, 2009). 300 years, and indeed several thousand years, is an instant in geologic time scales, and present evidence such as earthquake swarms, crustal deformation and hydrothermal activity in the caldera strongly suggests that there is still magma close to the surface, and that more eruptions may be just around the corner.
SEISMIC IMAGING OF MAGMA BODIES
A. Seismic Waves
A seismic wave is, simply put, a sound wave that propagates through the Earth and is usually generated by an earthquake or man-made source. Seismic waves are not, however, identical to sound waves that propagate through air, or another fluid. A seismic wave consists of several components, two of which propagate through the body of the Earth. These so-called “body waves” can be distinguished from seismic “surface waves”, which only propagate at the very surface of Earth and will not be dealt with in this paper (Burger et al, 2006). The two types of seismic body waves generated by earthquakes or man-made sources are termed P (or primary) waves, and S (secondary or shear) waves. As Fig. 1 shows, P-waves propagate compressions and dilations, whereas S-waves are transverse, that is, particles through which an S-wave passes are disturbed in a direction perpendicular to the wave’s direction of propagation (Burger et al, 2006). S waves rely on a material having shear strength, thus they do not propagate in fluids.
An important quality of each type of seismic wave is its velocity in a given material. The velocities of P and S waves are given as follows:


where K is the bulk modulus: a measure of the incompressibility of the material.
G is the rigidity modulus: a measure of the material’s resistance to shear.
r is the density of the material through which the wave propagates.From these simple relations, it can be observed that
and that both wave velocities decrease as density is raised, or as resistance to compression and/or shear is reduced (Burger et al, 2006).
B. Reflection and Refraction In the Earth
Just like any other wave, seismic waves will undergo reflection and refraction when they encounter an interface between two materials with different wave velocities. For example, if there were a magma body underneath the surface, a seismologist would expect to record the reflections of seismic waves off of it. By studying the path of the wave, and the time it took to travel from the focus to the presumed magma body, he can estimate the location and depth of the body (Burger et al, 2006). Refractions of seismic waves are also useful in determining subsurface structure. Often, in refraction studies, artificial seismic waves are created close to the surface by triggering explosions, and therefore the location of the focus is known very accurately (Hill et al, 1985). P-wave arrival times can then be observed, and an algorithm can be used to find the best-fit model of ray-paths with arrival times that correspond most closely with the observed times. These ray-paths can then be analyzed to provide information about the wave velocities in the subsurface, which can tell us about the properties of the materials in different layers. The results of one such analysis can be seen in Fig. 2.
C. Seismic Imaging of Magma Underneath Long Valley Caldera
Both active (as seen in Fig. 2), and passive seismic imaging work has been carried out in the Long Valley Caldera. Active seismic imaging consists of using explosives, or other artificial means, to create seismic waves at a shot point, and then recording them with a series of seismometers, usually spaced fairly evenly along a line (Burger et al, 2006). Passive seismic imaging relies on natural seismic waves, that is, earthquakes, in order to glean information about subsurface structures. In the late 1970s and early 1980s, Long Valley experienced a sharp increase in seismicity, providing ample opportunity for passive seismic studies (Rundle & Hill, 1988). Steeples & Iyer (1975) carried out a study of teleseismic events (that is, distant earthquakes) in Long Valley Caldera in which they calculated P-wave delays. They calculated these delays, or residuals, by the following formulae:
(Eq. 3)
(Eq. 4)
is the absolute residual.
is the arrival time of an earthquake at station i.
is the origin time of the earthquake.
is the expected travel time from a table based on the structure of the Earth’s mantle. At this point, Steeples and Iyer had an absolute residual that did not mean much for a local crustal study, as there was no telling what part of the residual was local in origin, and what had to do with more distant effects. Therefore, they computed
, or a relative residual, by subtracting the absolute residual at station I by the absolute residual calculated for a reference station on Casa Diablo Mountain. The researchers found
values of up to 0.3 s at stations that were located on the opposite (northwest or southeast) end of the caldera from the direction of the teleseismic waves. This suggests that there was a body of low-velocity material below the middle of the caldera, as only those waves that had to travel across the caldera were delayed appreciably. Steeples and Iyer concluded that this body is a chamber of magma, or at least partially melted rock, at a depth of roughly 12 km.
Another type of seismic wave effect that can point to a body of magma is called attenuation. As mentioned earlier, fluids generally do not support much S-wave propagation, as they do not have shear strength. A body of magma could therefore be expected to block, or at least attenuate, S-wave propagation through it. This effect was specifically targeted in Long Valley Caldera by Ryall and Ryall (1981). The researchers recorded over a hundred local earthquakes (as opposed to the teleseismic events recorded by Steeples and Iyer) and looked for attenuation at several stations in the area (Fig. 3a). They found that S-waves were missing or severely attenuated for most earthquakes originating in the southern portion of the Caldera when recorded by stations northeast of the Caldera. This would indicate a body of magma present near the middle of the Caldera (Fig. 3b), consistent with other seismic studies.
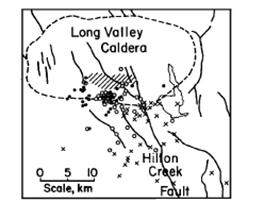
Fig. 3
(a) Triangles are recording stations. Solid lines indicate no attenuation recorded at sites. Dashed lines indicate intermediate attenuation. Dotted lines indicate missing S-waves and P-wave attenuation. Notice that stations inside the Caldera (LMC, CLK, ORC) did not detect attenuation from mostly very nearby earthquakes. This suggests that these S-waves traveled over the magma body, putting a lower limit for the depth at 7-8 km.
(b) X’s indicate earthquakes that did not display attenuation. Open circles are earthquakes that were attenuated when recorded at some sites, but not others. Filled circles indicate earthquakes that were found to be attenuated by many of the sites, especially those to the Northeast (e.g. FER, MNA, TNP)
(Adapted from Ryall & Ryall, 1981)CRUSTAL DEFORMATION
Crustal deformation is a very common phenomena in volcanically active areas, and is one of the key changes monitored by scientists when attempting to predict if an eruption is imminent or not. Measurement of this deformation can be done in many ways, with many instruments, but I will discuss only a few: leveling and EDM, as well as GPS.
Ground-based geodetic measurement techniques include leveling (for vertical deformation) and EDM, or electronic distance meter, for horizontal deformation (McGuire et al, 1995). Leveling uses two quite simple tools, a graduated measuring staff and an instrument that consists of a telescope with a central cross-hair. Both devices must be kept as level as possible, and are ideally both equipped with spirit bubble levels (McGuire et al, 1995). Leveling measurements are simply measurements of relative height difference between points. If absolute height changes are desired a particular leveling procedure must include at least one point with a known height. Measurement taking is pictured in Fig. 4.
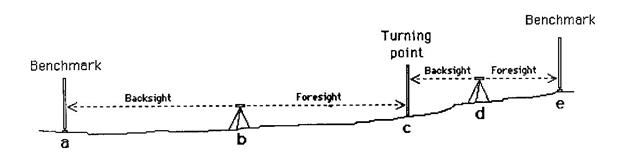
Fig. 4 The leveling procedure consists of centering the crosshair of the telescope on the staff located at a certain benchmark behind the telescope. Then the staff is moved and measured in front of the telescope at the turning point. Finally, the telescope is moved past the turning point, which is measure again. Lastly, the staff is moved in front of the telescope and another foresight is taken. The total height difference between points a and e is obtained by the expression: Height Diff. = ab – cb + cd – ed. Where the large letters indicate the benchmark/turning point measured and subscript indicates the location of the telescope (Adapted from McGuire et al, 1995).
EDM consists of a laser emitter on a tripod, and a reflector positioned some distance away (the distance to be measured). The laser’s amplitude is modulated at a known and fixed frequency. The distance between the laser and reflector is measured using wavelength of this modulation. Several measurements are taken, varying the frequency and therefore wavelength. The expression for half of this distance is:
(Eq. 5)
where U is the wavelength of modulation, n is some integer, and L is the fraction of the wavelength remaining. U is known, and L is determined by the EDM by measuring the phase difference between the transmitted and received light. Several measurements will provide enough information to determine reasonable values of n, and therefore D (McGuire et al, 1995).
GPS (Global Positioning System) is a much more modern method of geodesy than either of the methods previously discussed. The system consists of three segments, the satellite, control, and user. There are at least 4 satellites visible at any time from any point on the Earth. In 3-dimensions, 4 overlapping spheres (with radii equal to the distance calculated between the user and each satellite are always sufficient to determine a unique location. The user carries a receiver that measure distance based on the offset between two identical codes: one that it reads out, and one that it receives from the satellite (McGuire et al, 1995).
B. Deformation in Long Valley Caldera and its implications
It has long been assumed that the extensive uplift (Fig. 5) at and near the resurgent dome in the center of the Caldera is caused, at least partially, by magma underneath the surface. However, it is not until fairly recently that geologists were able to restrict the geometry of the magma body based on the nature of the deformation. Tizzani et al. (2009) attempt to do just this. By using a combination of leveling, EDM, GPS and InSAR, a type of radar deployed by satellites, they can form a rough picture of the magma body causing the uplift. EDM and InSAR data from 1992-1999 were used first to constrain the geometry of the body, then leveling, GPS, and microgravity data (Fig. 5c) since 1982 were used to try to pin down the density of the magma body. See Fig. 5b for illustration of their modeling process.

(b)
(c)
CONCLUSION
Based on geodetic (leveling, EDM, InSAR, GPS) and geophysical (seismic and gravitational) data, there is much evidence for a magma chamber located several kilometers beneath the resurgent dome in Long Valley Caldera. The chamber is probably a prolate spheroid and has probably undergone significant expansion in volume and mass since the late 1970s, as evidenced by crustal deformation and gravity changes.
The Long Valley Caldera can still be considered an active volcanic area. The geophysical confirmation of the existence, and preliminary description, of a magma body only a few kilometers below the surface here is another reminder of this fact, along with more visceral signs such as hydrothermal activity, earthquakes, and CO2 emission (see Sorey et al, 2000) As deformation and seismic modeling continues to become more advanced and accurate, including the developing science of tomography (e.g. Sanders et al, 1995) so too will geologists’ ability to predict the next eruption in time to issue warnings. Someday we may be able to analyze seismic waves and produce a real-time picture of, not just the main magma chamber, but also the whole magma plumbing system underneath the Caldera.
References
Burger, R. H., Sheehan, A. F., Jones, C. H., 2006, Introduction to applied geophysics: Exploring the shallow subsurface. New York & London: W.W. Norton & Company.Hill, D.P., Kissling, E., Luetgert, J.H., and Kradolfer, U., 1985, Constraints on the upper crustal structure of the Long Valley Mono Craters volcanic complex, eastern California, from seismic refraction measurements: Journal of Geophysical Research, v. 90, no. 13, p. 11,135-11,150.
McGuire, B., Kilburn, C. R. J., Murray, J. (Eds.), 1995, Monitoring active volcanoes. London: University College London Press.
Rundle, J.B., and Hill, D.P., 1988, The geophysics of a restless caldera; Long Valley, California: Annual Review of Earth and Planetary Sciences, v. 16, p. 251-271.
Ryall, F., and Ryall, A.S., Jr., 1981, Attenuation of P and S waves in a magma chamber in Long Valley Caldera, California: Geophysical Research Letters, v. 8, no. 6, p. 557-560.
Sanders, C.O., Ponko, S.C., Nixon, L.D., and Schwartz, E.A., 1995, Seismological evidence for magmatic and hydrothermal structure in Long Valley Caldera from local earthquake attenuation and velocity tomography: Journal of Geophysical Research, v. 100, no. B5, p. 8311-8326.
Sorey, M.L., Farrar, C.D., Gerlach, T.M., McGee, K.A., Evans, W.C., Colvard, E.M., Hill, D.P., Bailey, R.A., Rogie, J.D., Hendley, J.W., II, and Stauffer, P.H., 2000, Invisible CO2 gas killing trees at Mammoth Mountain, California: U. S. Geological Survey Fact Sheet FS 0172-96, 2 p.
Steeples, D.W., and Iyer, H.M., 1976, Low-velocity zone under Long Valley as determined from teleseismic events: Journal of Geophysical Research, v. 81, no. 5, p. 849-860.
Tizzani, P., Battaglia, M., Zeni, G., Atzori, S., Berardino, P., Lanari, R., 2009, Uplift and magma intrusion at Long Valley caldera from InSAR and gravity measurements: Geology, v. 37, no. 1, p. 63-66.
U.S. Geological Survey. (October 9, 2009). Geologic History of the Long Valley Caldera and Mono-Inyo Craters Volcanic Chain. In Long Valley Observatory. Retrieved June 10, 2010, from http://volcanoes.usgs.gov/lvo/about/history.php.
U.S. Geological Survey. (October 27, 2009). FAQs - Measuring Earthquakes- Q: What is a P-wave? An S-wave?. In Earthquake Hazards Program. Retrieved June 10, 2010, from http://earthquake.usgs.gov/learn/faq/?faqID=26.