Geology and Natural Heritage of the Long Valley Caldera
Land Subsidence in Las Vegas Valley
as a Result of Aquifer-System Pumping
Alex McRae
Abstract
Las Vegas is a major city in the middle of an arid alluvial valley, and for years has been pumping water from from the ground to support its rapid growth. Pumping began in 1905, and land subsidence as a result of compression of the aquifer by removal of water was first detected in 1935 (Bell, n.d.). This land subsidence continues today, although it has slowed since the mid-nineties, and is measured mainly by conventional leveling, GPS, and InSAR (Bell, et al, 2002). The objective of this paper is to look at the processes that cause subsidence, actions by the city of Las Vegas to prevent it, and the issues and debates involved.
Introduction
Las Vegas is currently one of the fastest growing cites in the United States, and has a permanent population of over half a million people, making it the 28th largest city by population in the U.S. as of summer, 2007 (Population Division, 2008). Land subsidence is a major issue in the city not only because the damage done to buildings, but largely because it is an indicator of a falling water table. Hotels and casinos are also a large factor in Las Vegas’s water usage. In 2006, the city received around 39 million tourists, a number which would increase any city’s water need drastically. Because tourism is known to be a major part of Las Vegas’s economy, land subsidence is of concern to business owners, and realtors working in affected areas (MacDonald, 2008).Land subsidence also raises environmental concerns about where the city is to get its water, and what the effects will be on those areas from which the water is taken. Plans have been suggested by the Southern Nevada water authority to create a pipeline running over 300 miles to collect water from other valleys in the state. This plan, however, has become the center of debate between Las Vegas and rural Nevadans (MacDonald, 2008).
Las Vegas Water Use
Pumping of groundwater from the main aquifers in Las Vegas Valley began in 1905. Much of the groundwater was pumped out, but a substantial amount was obtained by artesian flow. However pumping did not increase to a very high amount until the 1950s, when the city needed the water to support growth (Bell, et al, 2002). The peak period of pumping in the history of the city was reached in the mid 1960s, and in 1968, the most intesive year of pumping, around 88,000 acre-feet/year of water was pumped from the ground (Bell, 1991). An acre-foot is the amount of water needed to cover one acre of ground in water one foot deep, equalling approximately 325,851 U.S. gallons, or 1233.48 cubic meters (MacDonald, 2008). In this area, most quantitative measurements of large amount of water are made in acre-feet, and sometimes measured in cubic hectometers. One acre-foot equals about 1,233 cubic hectometers (Burbey, 1995). Since the 1960s, pumpage of water from the aquifers has far exceeded the natural rate of recharge for the aquifers, and has caused land subsidence and fissures. In 1999, water was pumped from the aquifer two or three times the natural rate of recharge (Amelung, et al, 1999).
In 1972, to support the continuing growth of the city, water from the Colorado River was diverted for use since because the aquifer alone was unable to meet the demands of the growing city. Since about 1980, water withdrawal from the aquifer has remained fairly constant at around 67,000 acre-feet/year. Almost all the rest of the water used by the city after this point has come from the Colorado River (Bell, n.d.). Illustration 1 shows a pie chart of southern Nevada water use in 2006 by percent (Southern Nevada Water Authority, 2006).
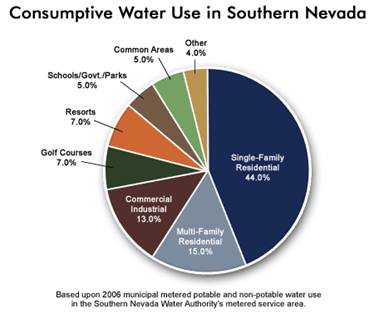
In the year 2006, fourteen percent of the water used in Las Vegas was by hotels, casinos, and golf courses. Of this fourteen percent, thirty percent was used on outdoors displays and exhibits such as the Bellagio’s fountains and the Venetian’s waterways, and the other 70% on indoor uses such as drinking water, restrooms, laundry, etc (Roberts 1). In the year 1999, water pumped from underground aquifers constituted about 25% of Las Vegas’s entire water budget (Amelung, et al, 1999). Assuming aquifer water usage for that year was about 67,000 acre-feet (remember water pumpage has remained fairly constant since 1980), and 30% of the aquifer water was used in outdoor displays, about 20,100 acre-feet/year of water from the aquifers were used in this manner, and approximately 46,900 acre-feet/year where used on the indoor functions of the hotels, casinos, and golf courses.
Residential statistics were inverted from the business statistics of water use in Las Vegas. For private uses, 70% percent of water was used outdoors for purposes such as car-washing, gardening, lawncare, etc, and the remaining 30% was on indoor uses like cooking, cleaning, drinking, and so on (MacDonald, 2008). Of the total annual water budget for Las Vegas, approximately 57.9% was used by residents in single-family and multi-family residential areas. Perhaps a reason for this reversal of numbers is that Las Vegas residents, because they live in an arid environment, require much more water to sustain healthy lawns and gardens than do inhabitants of wetter climates in the nation. Meanwhile in the hotels, 39 million tourists (if we follow 2006) would require much more water for drinking, cooking, restrooms, etc than do the city’s approximately 500,000 permanent residents.
According to Falk Amelung, et al, in the year 1999 water was being extracted from the aquifer system two or three times faster than the rate at which the aquifers were recharging themselves. This is substantially less than in the year 1995, when 375,000 acre-feet of water were pumped from the aquifer system, while 35,000 acre-feet was the natural recharge rate (Burbey, 1995). This means in 1995, water was pumped from the system over ten times faster than the natural rate of recharge for the aquifers. This over-withdrawal of water is the cause of what is called a cone of depression, which will be discussed later.
Geologic and Hydrologic Setting of Las Vegas
The main factor behind the debates over water use and aquifer pumping basically relate back to the fact that Las Vegas is a large, growing city located in an arid environment that receives only about four inches of annual precipitation (Roberts, 2005). The reason for this is the rain shadow effect. The rain shadow effect is where rain clouds usually cannot make it over a range of mountains, making one side much wetter, and leaving the other side more arid. Because Las Vegas is located in the Basin and Range Province, the rain shadow effect grows more and more dramatic as rain clouds and weather systems move from west to east along the continent, running into mountain ranges like the Sierra Nevadas, the White Mountains, and others along the way. Las Vegas is located in Las Vegas Valley, an alluvial valley that has been filled in with poorly consolidated sediment transported by water from the surrounding mountains. Near the base of the mountains, sediment is typified by coarse-grained material while the central region of the valley has finer clay deposits. Clay minerals, which are not very permeable to water, in the central, fine-grained deposits are responsible for creating the confined and semi-confined aquifers in the valley (Bell, et al, 2002). On average, the elevation of the water table is between 200 and 300 meters below the surface, although this has changed drastically in many areas since the intensive pumping that started in the 1950s (Bell, n.d.).
Changes in Water Table Elevation
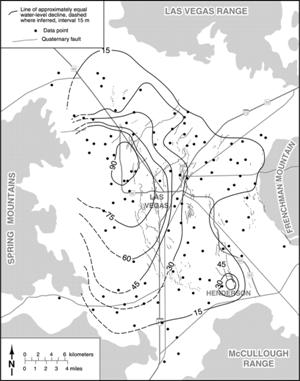
Throughout Las Vegas valley, changes in elevation of the water table have varied over different areas. In 1990, a study compared the water table elevation of that year with the pre-pumping water table elevation, and it was found that the average decline in elevation of the water table was between 15 and 30 meters, however the northwest part of the valley has seen a decline of up to 90 meters (Bell, et al, 2002). See illustration 2 for a visualization of this (Bell, et al, 2002).
(Illustration 2)- This shows a map of Las Vegas valley, with contour lines showing water level decrease from pre-pumping to 1990
In illustration 2, examination of the contour lines (representing lowering of the water-level), reveals a conically shaped depression in the elevation of the water, 90 meters at the deepest going up to 15 meters (Bell, et al, 2002). This is called a cone of depression.
A cone of depression, mentioned earlier, is a result of drawing down the water level by means of pumping. When a well pumps water from the ground, it draws water from a cylinder-shaped volume about itself, and the surrounding water-level lowers in a conical shape, which is indicative of aquifer compression (Lundgren, 1986).
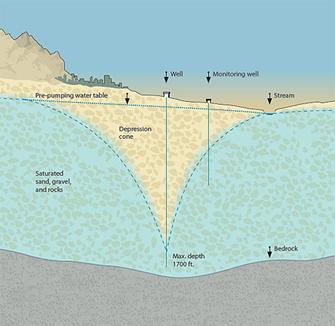
(Illustration 3)- This shows a cross-sectional view of a cone of depression.
Cones of depression are important to observe and measure because a lack of water in the previously water-saturated, poorly-consolidated alluvial sediments in a place like the Las Vegas Valley leads to land subsidence, a compaction of sediment layers dried by the drawing down of the water table (Flawn, 1970). Land subsidence has a very damaging effect on plumbing, roads, and the foundation of buildings (Bell, n.d.).
Land SubsidenceOne of the most important concepts in learning about subsidence is pore pressure. Pore pressure, basically, is the amount of water in a substance like the alluvial deposits of Las Vegas Valley, and provides a measurement of the outward pressure that water in the pores of a substance exerts. Water has the property of outward pressure exertion because water cannot be compacted. In deposits like Las Vegas’, the more water there is contained within, the higher the pore pressure and the less the deposits will be compacted (Lundgren, 1986).
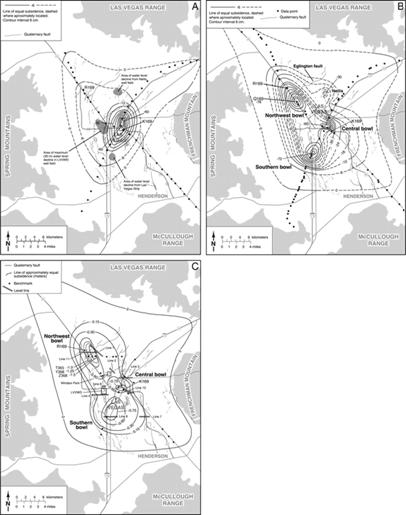
In areas where pumping has been highest and the water level has decreased the most (see illustration 4), the greatest amounts of subsidence have been observed. In the northwestern part of the valley, where water levels have dropped up to 90 meters, subsidence is also highest with maximum decline at 1.5 meters between 1963 and 1999 (Bell, n.d.). See illustration 4 for three maps of land subsidence for years 1935-1987 (Bell, et al, 2002). It can be concluded from this that the measured land subsidence is caused mostly by compaction of the valley’s sediment layer as water has been pumped out of the aquifer system and the pore pressure of the once-saturated material decreased.
Methods of Measuring Land Subsidence and Deformation
There are three main ways that land subsidence has been measured in Las Vegas valley since 1935, conventional leveling, GPS, and InSAR. Conventional leveling has been the only method used since the earlier half of the 20th century, as the other methods were not developed and ready for use until the 1980s (Bell, n.d.). GPS and InSAR are widely used in measuring deformation in the valley today because of their high, sub-centimeter precision (Pritchard, 2006).
(Illustration 4)- The first map shows subsidence between the years 1935 and 1963. The second map shows subsidence between 1963-1980, and marks growth of three main subsidence centers in the northwestern, central, and southern parts of Las Vegas. The third map shows subsidence between 1963-1987 (Bell, et al, 2002).
Conventional leveling was used to measure the maps in illustration 4, and initially, 75 benchmarks were surveyed to measure the amount of ground displacement. Using this method, it was determined that the three main subsidence bowls in the valley, the northwestern bowl, the central bowl, and the southern bowl had all subsided between 60 and 78 cm. The northern bowl, where subsidence has been greatest, subsided 78 cm, the central bowl 60 cm, and the southern bowl 72 cm (Bell, et al, 2002).When making measurements for the 1963-1987 map, only 28 of the original benchmarks remained because of heightened development in the city, so the measurements taken in 1987 were used to revise the 1963-1980 map (Bell, et al, 2002).
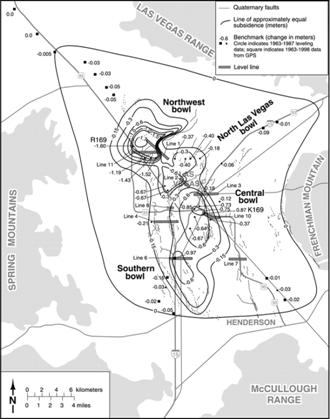
GPS, which became more available in the 1990s, soon became a much more precise way of measuring ground deformation than conventional leveling. From 1998 to 1999 alone, measurements at 11 different stations in the northwestern subsidence bowl showed declination up to 3.5 cm, a number that would be much harder to measure using conventional leveling (Bell, et al, 2002). Using Trimble GPS units that contain both a base station and a rover for higher precision, measurements have been made down to the millimeter. In the Las Vegas Valley, subsidence was measured once again in 2000 with conventional leveling, InSAR, and GPS. This study yielded a new map of subsidence in the valley from 1963 to 2000 and the highest amount of total subsidence: 1.7 meters in the northwestern bowl (Bell, et al, 2002).
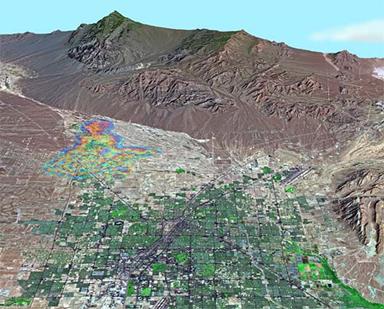
GPS is a very effective way of measuring subsidence in itself, but often it is used to calibrate InSAR measurements. InSAR, which stands for Interferometric Synthetic Aperture Radar, involves a satellite that takes two or more radar images (SAR images) of a particular area at a certain time apart, and an interferogram is created from the subtraction of phases within each pixel of the images (Pritchard, 2006) . The result is a color coded map that shows sub-centimeter surface movement and deformation. The colors on an InSAR map do not represent elevation. They represent change, categorized by color. This technique came into widespread use in the 1990s, and has been used often to measure subsidence in the Las Vegas Valley (Bell, et al, 2002).
(Illustration 5)- Map of subsidence in Las Vegas Valley from 1963-2000 using conventional leveling, InSAR, and GPS. Note high amount of subsidence in the northwestern bowl (Bell, et al, 2002)
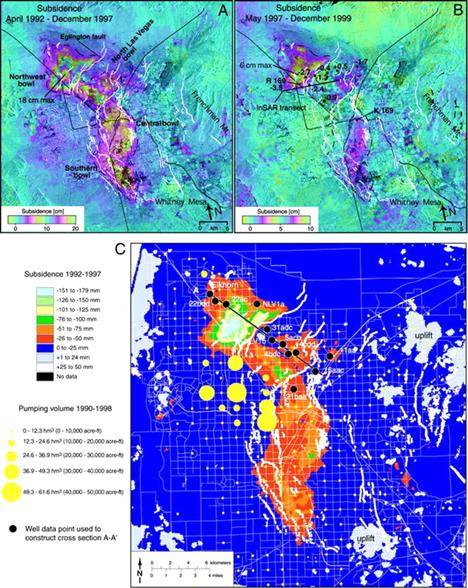
InSAR measurements of Las Vegas Valley from 1992 to 1999 showed very similar results to GPS and conventional leveling measurements during the same time, however InSAR maps revealed slight changes throughout the entire valley and other smaller measurements not collected by other methods. The following maps represent InSAR measurements from 1992-1997 in the first map, 1997-1999 in the second map, and the third map shows 1992-1997 InSAR data as well as pumping data from 1990-1998 (Bell, et al, 2002). One color cycle on this map stands for 5 cm of deformation. In the central part of the valley, about 3 cm of deformation occurred, and about 6 cm in the northwestern bowl (Bell, et al, 2002).
(Illustration 6)- InSAR subsidence map superimposed over a 100m digital elevation map. Note the rainbow colored elevation changes of the northwestern bowl (NPA Group)
(Illustration 7)- InSAR maps show deformation (subsidence) for years: A) 1992-1997 B)1997-1999 C) Water Pumpage 1990-1998, InSAR 1992-1997 (Bell, et al, 2002)
Actions By Las Vegas
In reaction to land subsidence and damage caused to public and residential areas as a result, Las Vegas began an artificial recharge program in 1990 to slow the land subsidence by increasing the pore pressure of the sediments underlying the city (Bell, n.d.). Between 1990 and 1999, water-levels in the aquifer system raised slightly, except in the northwestern bowl, where subsidence and compaction of sediments was most dramatic (Amelung, et al, 1999). Since 1990, between 97 and 243 acre-feet/year have been put back into the aquifer system through the artificial recharge program (Bell, et al, 2002).
The most substantial ways in which Las Vegas is trying to mitigate land subsidence is by becoming more efficient with water use, and by trying to find other sources of water. Efficiency has increased substantially since the 1980s, but has slowed in recent years. In the later half of the 1980s, per capita water use was about 350 gallons/day, and this number dropped to approximately 255 gallons around the turn of the millennium (MacDonald 2007). In 2005, per capita water use dropped even further; down to around 190 gallons per day (Roberts, 2005). Efficiency has also been increased by using non-potable, recycled water for golf-courses, and outdoor displays at casinos and hotels (MacDonald, 2008). However, the Southern Nevada Water Authority expects this statistic to decrease only by 10 gallons per day by the year 2035 (MacDonald, 2007).
Even with this sizable increase in efficiency, some still believe Las Vegas will have to find more water in the near future. In 2008, the Las Vegas Sun ran a report saying that Lake Mead, Las Vegas’s principle reservoir could “run dry” by 2021, leaving the city without water (Sweet, et al, 2008). This is assuming, though, that no new measures are taken to secure alternate water sources, which is not likely, given recent actions, such as designing a pipeline to retrieve water from other basins by the city of Las Vegas. During summer, 2008, the reservoir was 50% capacity and a subsequent study was undertaken to find out the cause. It was found that water had been diverted from the Colorado River assuming that the average output was 17,000,000 acre-feet/year, while the actual output of the river is closer to 15,000,000 acre-feet/year. This discrepancy, along with recent draught, is what has caused the lowering of the reservoir’s water-level (MacDonald 2008).
Las Vegas has recently been planning a large-scale pipeline system, like the one used by Los Angeles, to collect water from other valleys in more northern parts of Nevada. This pipeline, which could bring the city up to 65 billion gallons of water a year and would extend at least 300 miles, has become the topic of heated debate between the city, where many say the water should rightfully be used; and people living in rural parts of the state, who see the pipeline as being reminiscent of water pumping from the Owens Valley by the city of Los Angeles in the previous century (MacDonald, 2007). A pipeline system of this magnitude would obviously help satiate the growing city’s need for water, but the engineering and cost of such a project would very likely be difficult obstacles for the city to overcome.
Conclusion
In an arid setting such as the Las Vegas Valley, water policies are obviously very important. This is why issues such as groundwater pumping and land subsidence are of such great importance to the city of Las Vegas. In Windsor Park, one subdivision in Las Vegas, subsidence was responsible for the damage of over 240 homes in 1989, and the cost was estimated to be approximately twelve million dollars (Bell, n.d.). Events like this express effectively the importance of water policy in relation to land subsidence and over-withdrawal of aquifers.
Works Cited
Amelung, F., Galloway, D. L., Bell, J. W., Zebker, H. A., & Laczniak, H. J. (1999). Sensing the ups and downs of Las Vegas: InSAR reveals structural control of land subsidence and aquifer-system deformation. Geology, 27(6), 483-486.
Bell, J. W., Amelung, F., Ramelli, A. R., & Blewitt, G. (2002). Land subsidence in Las Vegas, Nevada, 1935-2000: New geodetic data show new evolution, revised spacial patterns, and reduced rates. Environmental and engineering geoscience, 8(3), 155-174.
Bell, J. W. (1991). Elevation changes associated with subsidence in Las Vegas Valley, NevadaRetrieved June 3, 2009, from http://iahs.info/redbooks/a200/iahs_200_0473.pdf
Bell, J. W. (n.d.). Las Vegas Valley: Land subsidence due to ground-water withdrawalRetrieved June 4, 2009, from http://geochange.er.usgs.gov/sw/impacts/hydrology/vegas_gw/
Burbey, T. J. (1995). Pumpage and water-level change in the principle aquifer of Las Vegas Valley, Nevada 1980-1990Retrieved June 4, 2009, from http://images.water.nv.gov/images/publications/Information%20series/34.pdf
Flawn, P. T. (1970). Environmental geology: Conservation, land-use planning, and resource management (pp. 42-43). New York: Harper & Row.
Hutchinson, A. (2007). Las Vegas tries to prevent a water shortage. Popular Mechanics.Lundgren, L. (1986). Environmental geology (pp. 130-386). Englewood Cliffs: Prentice-Hall.
MacDonald, G. M. (2008). Las Vegas, water, and the West. AAG newsletter, 43(9), 7-9.
NPA Group (n.d.) Las Vegas subsidence due to groundwater abstraction (n.d.). Retrieved June 4, 2009, from http://www.npagroup.com/insar/apps/pdf/lasvegas_insar.pdf
Population Division, U.S. Census Bureau (2008, July 10). Table 1: Estimates of the population for incorporated places over 100,000, ranked by July 1, 2007 population April 1, 2000 to July 1, 2007Retrieved June 13, 2009, from http://www.census.gov/popest/cities/tables/SUB-EST2007-01.csv
Pritchard, M. E. (2006). InSAR, a tool for measuring Earth's surface deformation. Physics Today. Retrieved June 4, 2009, from http://www.geo.cornell.edu/eas/PeoplePlaces/Faculty/matt/vol59no7p68_69.pdf
Roberts, C. (2005, July 29). Vegas heading for 'dry' futureRetrieved June 4, 2009, from http://news.bbc.co.uk/2/hi/science/nature/4719473.stm
Southern Nevada Water Authority (2006). Consumptive water use in southern NevadaRetrieved June 5, 2009, from http://www.snwa.com/html/cons_waterfacts.html
Sweet, P., & Wise, Z., et al. (2008). Quenching Las Vegas' thirstRetrieved June 15, 2009, from http://www.lasvegassun.com/news/topics/water/