Geology and Natural Heritage of the Long Valley Caldera
The Relation of Carbon Dioxide to Plate Tectonics
Alyssa FitzGerald
Abstract
In high concentrations, carbon dioxide is toxic to most forms of life. Volcanic areas are especially at risk for CO2 seepage. This paper focuses on the carbon dioxide emissions of Mammoth Mountain in the Long Valley Caldera in eastern California and Lakes Nyos, Monoun, and Kivu in volcanic areas of Africa. The tectonics involved in each case are also discussed. Methods used to measure gaseous emissions and emission rates include COSPEC, LI-COR, FTIR, and direct analysis. Results from these samples can determine future volcanic activity at a site as well as warn nearby inhabitants of the dangers of carbon dioxide asphyxiation.
Introduction
Carbon dioxide is an odorless, colorless gas naturally present in the atmosphere in small quantities. However, volcanic activities can result in masses of carbon dioxide gas above the earth’s crust in much larger quantities than normally present in the atmosphere. These high concentrations of carbon dioxide are toxic to most forms of life, including humans, animals, and plants. Volcanologists concern themselves with CO2 concentrations because high concentrations can indicate the locations of past, present, or future volcanic activities and also can create hazards for humans and other inhabitants. Human fatalities have occurred at a number of locations, including Mammoth Mountain in California and Lakes Nyos and Monoun in Cameroon, but the tree deaths at Mammoth Mountain provide a more striking and lasting impression. Similar to these sites is Lake Kivu in the Democratic Republic of the Congo, whose waters possess extremely high concentrations of carbon dioxide and other gases. Although a massive eruption has not been documented from this lake, the potential is high. Various techniques measuring CO2 and other gaseous emissions can help determine if an eruption is evident in volcanic areas such as the above mentioned. Also, these techniques can help indicate the tectonic movements of plates, which are the bases of all volcanic activity and gaseous emissions.
Gas Chemistry and Carbon Dioxide Toxicity:
Normally, CO2 is not harmful to living beings on earth; to the contrary, it is a necessary aspect of everyday living as a product of respiration for breathing animals and as the primary source for producing sugars in photosynthesizing plants. As a matter of fact, plants use so much carbon dioxide that the CO2 concentration within the atmosphere changes with the season. In spring and summer, when plants are in bloom and actively photosynthesizing, the carbon dioxide concentration decreases while the opposite occurs during winter months. Even though this gas is usually nontoxic, extremely high concentrations relative to the typical trace amounts in the atmospheric can be fatal to both animals—including humans—and plants.
Air has a density of 1.2929 kg/m3, while the density of CO2 is 1.9769 kg/m3, making CO2 about 1.5 times denser than air (“Carbon Dioxide Uses”, 2008). An excess of the denser carbon dioxide would then sink relative to atmospheric air, which normally only contains about 0.038% (380 ppm) CO2 (“Carbon Dioxide Uses”, 2008). As the gas is released in small amounts into the air, it is quickly dispersed. However, in extremely large quantities especially in closed and poorly ventilated areas, the carbon dioxide will remain in high concentrations. For humans, CO2 can be fatal at 10%, 263 times the normal atmospheric content (Mallinger, 1996). Before death, symptoms of carbon dioxide poisoning include “headache, sweating, rapid breathing, increased heartbeat, shortness of breath, dizziness, mental depression, visual disturbances or shaking” as well as unconsciousness and coma (Mallinger, 1996). Valleys and other natural depressions are especially prone to high concentrations of the gas, especially when near active volcanic sites.
Plate Tectonics and Carbon Dioxide Seepage:
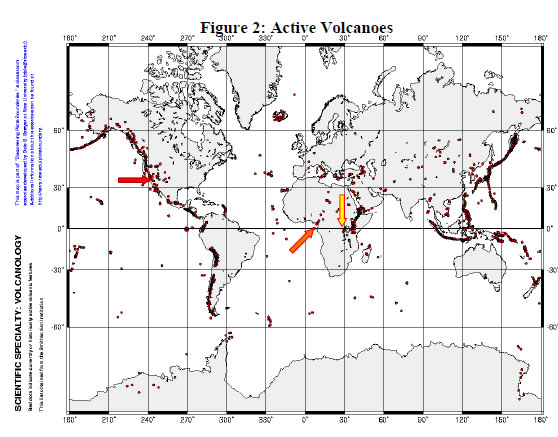
Pockets of CO2 reside underneath the earth’s crust (Sorey, 2007). Occasionally, these pockets become disturbed through volcanoes or earthquakes, causing the carbon dioxide to rise to the surface through cracks in the crust known as faults. Therefore, high earthquake and volcano activity can determine areas of possible carbon dioxide seepage. The theory of plate tectonics helps establish these commonly disruptive locations. Plate tectonics is the concept that the entire world is made up of a mosaic of pieces that constantly move relative to each other (Hamburger). Plates bump into each other at the boundaries, with these interactions often resulting in volcanoes and earthquakes. Figure 1 shows a map of the documented earthquakes that occurred over the course of 35 years and Figure 2 shows the active volcanoes in the world, while Figure 3 relates the boundaries of the mosaic of plates. One notices that the great majority of earthquakes and volcanoes mirror the plate boundaries, adding support to plate tectonics. Plate tectonics, therefore, can also determine where faults are most likely to occur, and consequently, where carbon dioxide emissions are more probable.
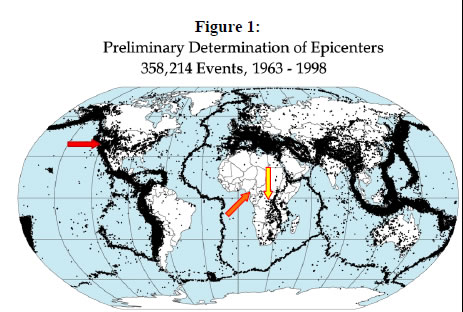
Figure 1:*modified from Roark, 2003
Figure 2: Active Volcanoes *Figure modified from Leeman 1998
Figure 3: Plates and Plate Boundaries *from "Plate Tectonics"
Figure 3 also communicates how the plates are moving relative to one another. The three types of plate interactions of divergent, convergent, and transform. This paper focuses primarily on the transform interactions between the North American and Pacific plates and the divergent movements of the African plate with its surrounding plates as the continental plate converges on itself in the west and separates from itself in the east. Where these interactions occur prove be sites of volcanic and earthquake activity, and also carbon dioxide emissions.
Established is the fact that carbon dioxide seeps upward through vents in areas of tectonic activity, but why does this occur? Deep within the earth, molten magma dissolves gases like water and carbon dioxide. As the magma rises, pressure becomes less and the gases trapped within the magma expand. This in turn makes the magma less dense, it rises more, and the cycle continues. When the magma reaches the surface, the gases expand and are either released into the atmosphere or become trapped within the rock (a common example is pumice). In small quantities, these gases when released into the atmosphere are quickly diffused. However, volcanic activity does not always produce “small” gas explosions. In large masses, released carbon dioxide will not dissolve as easily into the atmosphere and will instead remain near the ground, putting anyone and anything in that area at risk.Mammoth Mountain and Long Valley Caldera:
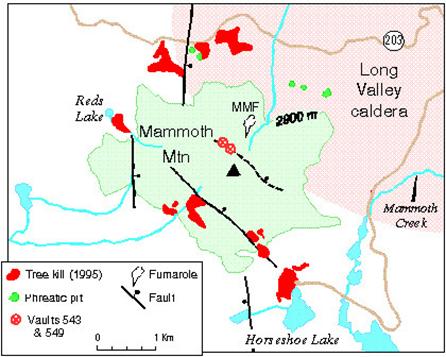
The Mammoth Mountain region is located in eastern California (refer to red arrows in Figure 1 and 2), on the edge of the Long Valley Caldera, the site of a massive eruption 760,000 years ago (Faure). When scientists first noticed dead and dying areas of trees, they assumed the reason was biological. However, further analysis proved that an excess of carbon dioxide poisoned the trees. To date, CO2 is responsible for the deaths of greater than 100 acres of trees (Sorey, 2007). Figure 4 shows the areas of tree deaths in the Mammoth Mountain area as of 1995. One notices that most of the tree deaths occur along and near fault lines. These cracks in the crusts provide places for CO2 to seep to the surface from underground pits; when the highly concentrated gaseous carbon dioxide meets with air, the CO2 remains near the ground because of its higher density. The high concentrations then cause the deaths of trees by cutting off their supply of oxygen (Sorey, 2007). Some human fatalities have even occurred in this region from the carbon dioxide (Hamburger, 2009).
One also notices in Figure 4 that the faults, the sites of CO2 seepage and their corresponding tree deaths, occur in a rough north to south pattern. This matches the movements of the North American plate and neighboring Pacific plate. Referring back to Figure 3 reveals that the Pacific plate is moving in a northwestern direction compared to the southeastern movement of the North American plate at the boundary, creating a transform boundary. The constant sliding and grinding of the two plates makes this an area high in tectonic activity. As the plates bump against each other, faults are produced, occurring in the same rough north-to-south pattern as shown in Figure 3. Figures 1 and 2 respectively show the high density of earthquakes and volcanoes found along this boundary. Evidence of other volcanic activity can be found in Figure 3 with the presence of fumaroles—openings in the crust with frequent gaseous emissions—and phreatic pits—sites where steam erupted from below the surface—in the Mammoth Mountain region. All of these reasons plus the carbon dioxide emissions mark this area as one greatly and frequently affected by the shifting plates, giving geologists a chance to study long and short-term effects of tectonic movements through their earthquake and volcano productions.
Figure 4: Tree Deaths at Mammoth Mountain, *Figure from “Carbon Dioxide and Helium Discharge”, 2001
African Sites of Carbon Dioxide Emissions and Fatalities:
Like Mammoth Mountain, areas high in tectonic activity—and corresponding CO2 emissions—are found in certain sections of Africa, namely Cameroon in western Africa and the Congo in central Africa, shown in Figures 1 and 2 by the orange and yellow arrows, respectively. Cameroon hosts the infamous Lake Nyos and nearby Lake Monoun. A delicate layering balance makes up Lake Nyos, with the bottom 150 of 200 m comprised primarily of sodium and carbon dioxide (Earle, 2001). In 1986, something, possibly an earthquake, landslide, or mudslide, disturbed the balance of the lake, causing the fluid CO2 to rise (Earle, 2001). As the carbon dioxide rose, lower pressure near the top of the lake transformed the liquid CO2 to a gas, which further caused faster rising, resulting in a massive gaseous CO2 cloud exploding from the lake in a limnic eruption. As stated previously, CO2 is denser than air and thus hugged the ground as it flowed into a populated valley. In total, 1700 people died as well as a number of livestock (“Lake Monoun and Nyos”, 2005). So this disaster could never repeat, in 1995 scientists began to “degas” the lake by piping the CO2 from the bottom and releasing it in small quantities into the atmosphere, where it dissipates harmlessly (Earle, 2001). This process, however, is fragile and dangerous, as shown with Lake Monoun. Lake Monoun, located near Lake Nyos, boasted 37 human deaths as an explosion of CO2 erupted only two years earlier.
The high amounts of CO2 at the bottoms of these lakes mark this area of Cameroon as another region high in tectonic activity. Cameroon is located on the western edge of the African plate, which is diverging from the South American plate (refer to Figure 3). The divergence means that the African plate is pushing inward, from west to east. Also, the two above lakes are located in a line of volcanoes that were probably formed during the creation of the Atlantic Ocean or from a mantle plume (Earle, 2000). This ancient tectonic activity plus the modern movement of the African plate result in disturbances in the mantle. Magma with exsolved gases, including carbon dioxide, rises upward during these disturbances. As the pressure lessens, the gases expand and rise faster, releasing in the bottom of Lakes Nyos and Monoun. The gases remain in solution until another disturbance causes the carbon dioxide to rise, similar as with the magma, exploding at the surface.
Lake Kivu is located on the eastern border of the Democratic Republic of the Congo, shown by the yellow arrows in Figures 1 and 2. Similar to Lakes Nyos and Monoun, Lake Kivu possesses a delicate mixture of layers of gases and is located near the volcanoes Nyamuragira and Nyiragongo (Wafula et al). Lake Kivu is located in the direct path of the Great Rift Valley, where the African plate is actually separating into two separate plates. Referring back to Figures 1 and 2 shows this to be an area high in tectonic activity. The separating plates allow magma from beneath the surface to rise, and as it rises, gases dissolve. The same system then occurs as in other volcanic areas: magma rises, the pressure decreases, gases expand and continue to rise. Gases have built up underneath Lake Kivu in even larger concentrations than Lake Nyos; a carbon dioxide explosion here would be a disaster.Gas Monitoring and Volcanic Eruption Prediction
Because gaseous emissions are associated with tectonic movements, an increase in these gases can indicate where a lot of motion is occurring. Especially around known volcanic areas, gaseous emissions can be associated with a possible future eruption. Sophisticated methods exist in order to monitor carbon dioxide, sulfur dioxide, and other gaseous emissions, and the results can then be used to predict when and if a volcano will erupt. These methods include COSPEC, LI-COR, FTIR, and direct analysis.
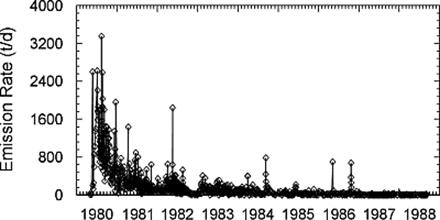 COSPEC, or correlation spectrometry, measures how much ultraviolet radiation a gas plume absorbs and then comparing the results with control standards determined (“Volcanic Activity”, 2008). Figure 5 shows COSPEC data from Mt. St. Helens from 1980-1988. One notices that the highest emissions occurred in 1980, the time of the last eruption. Since then, the emissions have decreased significantly. Using COSPEC to measure a gas plume over a period of time could show if a volcano had increased underground activity, which could then predict if an eruption was at hand.
Figure 5. COSPEC data of CO2 emissions, from http://volcanoes.usgs.gov
Figure 6: LI-COR Data from Mammoth Mountain, from http://volcanoes.usgs.gov
LI-COR strictly measures carbon dioxide emission rate by sampling the air of an active volcano at different heights. The rate is then calculated through the different concentrations at increasing elevations from a volcanic plume.
Figure 6 shows LI-COR data taken from Mammoth Mountain. The red region, the highest concentration of carbon dioxide mirrors the area with the dead trees (Gerlach et al, 1999).
The Fourier transform infrared spectrometer system (FTIR) can measure several different gases within a plume at the same time through direct or indirect sampling of the plume (“Volcanic Activity”, 2008). However, one of the most accurate monitors of gaseous emissions is direct sampling at or very near the vent or opening. Because lab analyses, though extremely detailed and accurate, can take days or weeks, direct analysis is not the best choice for monitoring quickly altering gaseous emissions (“Volcanic Activity”, 2008). Also, direct analysis involves a scientist actually sampling near the vent, which can be impossible, impractical, or fatally dangerous.Conclusion:
Measurements of carbon dioxide provide important evidence of volcanic activity. Using various techniques to measure gaseous emissions can determine when a volcano is becoming more restless. These measurements can also warn nearby inhabitants of the increasing concentrations of gases, which can be toxic. The basis for carbon dioxide and other gaseous emissions is explained through the plate tectonic theory. Every geological process depends on how the plates are moving. To understand CO2 and other gas emissions through faults and vents, tectonics must first be studied and understood. The interactions at plate boundaries define the geologic events that occur. The transform boundary between the Pacific and North American plates causes faults that occur in a north-to-south pattern. The constant sliding also makes this area high in earthquakes and volcanic activity, including carbon dioxide seepage like that found at Mammoth Mountain. The delicate gas balances found in lakes in Africa result from the African plate moving in on itself and separating into two plates, diverging from the South American plate on the western border and the Arabian plate on the northeastern border. Lakes Nyos and Monoun near the western border have both resulted in human fatalities as carbon dioxide exploded from their depths. Lake Kivu in the Great Rift Valley is another lake with a high concentration of carbon dioxide located near fuming volcanoes where a limnic eruption could prove to be even more deadly than the one at Lake Nyos. Studying carbon dioxide emissions at sites such as these and predicting the next eruption could then save thousands of lives that otherwise would be lost to this silent, odorless, colorless killer.Works Cited
“Carbon Dioxide and Helium Discharge from Mammoth Moutnain”. U.S. Department of the Interior, U.S. Geological Survey Volcano Hazards Program. Long Valley Observatory. 27 December 2001. <http://lvo.wr.usgs.gov/CO2.html>.
“Carbon Dioxide (CO2) Properties, Uses, Applications”. Universal Industrial Gases, Inc. 2008. <http://www.uigi.com/carbondioxide.html>.
Earle, Stephen. “Degassing Lake Nyos”. Earth Science News. 2001. <http://records.viu.ca/~earles/nyos-feb01.htm>.
Faure, Gunter. Origin of Igneous Rock: The Isotopic Evidence.“Long Valley Caldera and the Bishop Tuff”. http://books.google.com/books?id=9aVUTgKDNYEC&pg=PA225&lpg=PA225&dq=Map+of+the+Cameroon+Line+and+Benue+Trough,+after+Fitton+and+Dunlop+(1985&source=bl&ots=kl_bhfLzHc&sig=riuC-Jc32ebjOUQuZnqTbvWDoq0&hl=en&ei=KDAtSrTTCJW-M9LuoeUJ&sa=X&oi=book_result&ct=result&resnum=1#PPP14,M1
Gerlach, T.M. et al. “Airborne detection of diffuse carbon dioxide gas at Mammoth Mountain, California”. Geophysical research letters. Vol. 26, n. 24, p. 3661-3664. U.S. Geological Survey. 1999. <http://volcanoes.usgs.gov/activity/methods/gas/mammoth.php>.
Hamburger, Michael. “Notes and Lecture”. Indiana University. 2009.
“Lake Monoun and Nyos, Oku Volcanic Field, Cameroon: Eruptive History”. 12 October 2005. <http://volcano.oregonstate.edu/vwdocs/volc_images/africa/nyos.html>.
Leeman, Bill, et al. “Nature vs. Man of Man vs. Nature? Relations between population trends and natural processes”. 29 September 1998. <http://www.ruf.rice.edu/~leeman/Man&Nature.html>.
Mallinger, Stephen, the Acting Director Directorate of Technical Support. “OSHA Hazard Information Bulletin: Potential Carbon Dioxide (CO(2)) Asphyxiation Hazard When Filling Stationary Low Pressure CO(2) Supply Systems”. United States Department of Labor. Occupational Safety & Health Administration. 5 June 1996. http://www.osha.gov/dts/hib/hib_data/hib19960605.html
“Measuring Volcanic Gases: Emission Rates of Sulfur Dioxide and Carbon Dioxide in Volcanic Plumes”. USGS Volcano Hazards Program. 25 September 2008. <http://volcanoes.usgs.gov/activity/methods/gas/plumes.php>.
“Plate Tectonics”. Fire Earth: Environmental Issues. 19 May 2008. http://feww.wordpress.com/tag/indonesia/
Roark, Jim. “Preliminary Determination of Epicenters”. Seismic Data. Digital World Tectonic Activity Map. 13 May 2003. <http://denali.gsfc.nasa.gov/dtam/seismic/>.
Sorey, Michael L., et al. “Invisible CO2 Gas Killing Trees at Mammoth Mountain, California”. USGS Fact Sheet. 9 July 2007. <http://pubs.usgs.gov/fs/fs172-96/>.
“Volcanic Activity: Direct Gas Sampling and Laboratory Analysis”. U.S. Geological Survey. U.S. Department of the Interior. 25 September 2008. <http://volcanoes.usgs.gov/activity/methods/gas/sample.php>.
Wafula et al. “NATURAL DISASTERS AND HAZARDS IN THE LAKE KIVU BASIN, WESTERN RIFT VALLEY OF AFRICA”. Department of Geophysics, Centre de Recherche Géophysique de Kinshasa, Graduate School of Sciences, Tohoku University. < http://iugg-georisk.org/presentations/pdf/Lake-Kivu-hazards.pdf>.