Geology and Natural Heritage of the Long Valley Caldera
Methods and Applications of Geological Monitoring Techniques
Mark Bowers
Abstract
Geologists use a variety of techniques to monitor volcanoes. Crustal deformation has long been measured with traditional ground based methods such as leveling data, triangulation, and distance measurement via laser ranging, tiltmeters, and strainmeters. Along with these techniques newer technology such as global positioning system receivers and Interferometric Synthetic Aperture Rader or InSAR are also being utilized to further monitor crustal deformation. Geologists also record seismic events such as earthquakes and monitor gas emissions in order to monitor and study volcanoes. This data can not only be used to study the processes at work in places like the Long Valley Caldera but can also be utilized as tools to help warn geologists of impending volcanic events to mitigate risks.
Introduction
The methods used for monitoring geological processes vary greatly. Each has its own drawbacks and benefits, but most can be put into two major categories. One major type of monitoring is done continuously. Continuous monitoring usually involves a fixed station for gathering data that is usually transmitted to be stored electronically such as fixed GPS stations, tiltmeters, and seismic stations. Another major type of monitoring is done at set intervals or as needed by geologists. These include surveys using leveling techniques, GPS, InSAR data, and gas emission readings.
I. Methods of Continuous Monitoring
A. Tiltmeters
Tiltmeters are one of the oldest methods of measuring crustal deformations on volcanoes. Tiltmeters are used to measure the change in the slope of the crust’s surface. They cost only a few thousand dollars, making them relatively inexpensive. There are a variety of tiltmeters that work in different ways. One common type of tiltmeter is a water-tube tiltmeter. These tubes are typically U-shaped and half filled with water. As one end raises relative to the other the water level changes also, basic water-tube tiltmeters will need this change measured manually but more advanced units can measure it electronically (Dzurisin- Tilt Measurements). Another type of tiltmeter is a bubble tiltmeter that again uses a liquid containing a bubble that moves relative to ground slope change the bubble’s movements are recorded precisely with electrodes that are placed in the liquid (Dzurisin- Tilt Measurements). Dry tilt measurement involves gathering data with precise surveying techniques then using algebra to interpret that data. The accuracy of these measurements is recorded in microradians, or how many millimeters of uplift per kilometer horizontal distance. The data directly correlates to ground tilt which makes it easy to interpret (Dzurisin 27). Tilt meter measurements are adversely affected by environmental factors such as precipitation and temperature (27). Furthermore, they are not necessarily representative of the entire section from which you are trying to gather data (27). Geologists deal with these problems by having many tiltmeters set up from which to compare data, and carefully choosing the placement of tiltmeter sites. (27).
B. Strainmeters.
Another form of volcanic monitoring commonly used is a strainmeter. Strainmeters measure the deformation of the earth’s crust. Strainmeters can be as simple as a wire placed over a crack or fissure with a displacement recorder attached to it. This method is very simple and cheap but susceptible to environmental interference (Dzurisin 27). Another method, though more expensive, places a thin-walled cylinder into a hole drilled into the ground, the cylinder fills with liquid which raises and lowers level in the cylinder as pressure increases and decreases on the cylinder (27). These stations can record data at a wide range from 1 to 100 Hz. (27). Strainmeters are expensive and time consuming processes. The equipment can cost over $10,000 and setting it up can take several months to become operational. (27).C. Global Positioning System Stations.
A relatively new system being utilized in volcanic monitoring is GPS or Global Positioning System units. GPS took years to develop and was originally a Department of Defense Project. (Drezner 238). The Department of Defense saw that each branch of the armed forces had various navigation systems that were specialized for specific uses. This was a costly way of doing things, which lead to the investment in alternative forms of navigation. The D.O.D. was also interested in a system that could be used for accurate weapon delivery (Drezner 238). The first three systems that were developed from this project were called TRANSIT and TRIMBLE, developed by the Navy, and an Air Force project called System 621B. (239). TRANSIT used seven orbiting satellites, which transmitted radio signals back to earth. Several ground-based stations tracked the satellites and users determined their position by tracking the Doppler shift of the satellite signals. (Drezner 238). TRANSIT is still in use today in marine applications despite its drawbacks of being slow to report a location and giving only a two dimensional position. (239).The Timation project greatly advanced much of the technology used in GPS today. It involved two experimental satellites, which contained accurate atomic clocks used for time transfer, much like modern GPS. In fact, these satellites were used as prototypes for the original GPS units (Drezner 238). The Air Force’s System 621B was similar to Timation and was the first to provide three-dimensional data: latitude, longitude, and altitude (238-289). Real progress wasn’t made on any system until April of 1973 when the D.O.D. decided that the Air Force should consolidate the various armed forces branches’ navigation systems into one project (289). In the coming decades, G.P.S would suffer many setbacks as its funding was reduced and even cancelled at one point from 1980-1982, due to skepticism of its value (289). However, aided by its great value to U.S. forces in Operation Desert Storm, the system would eventually reach full operational functionality in March of 1994 with the launch of the 24th Block II Satellite (246). GPS found a niche in the civilian market selling to surveyors even as early as the mid 80’s. The real boom for the industry, however, came from Operation Desert Storm, when the need for GPS units caused the armed services to buy 13,000 receivers from private companies to supply their troops and vehicles. (Drezner 250-251). The money that poured into the industry helped develop it for private and scientific use.
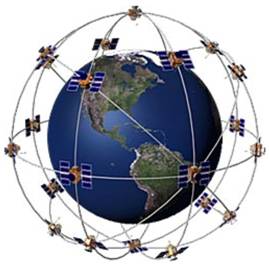
GPS receivers work on the concept of trilateration. The receiver interprets a signal from a series of twenty-seven orbiting satellites and uses this signal to calculate the distance from each. Using each of these distances, the GPS is able to calculate its position (Brain 3). The receiver requires three satellites to determine its two-dimensional position, latitude and longitude, and four to determine its three-dimensional position or elevation (3).
The way that the receiver calculates the distance to the satellite is relatively simple. The satellite starts transmitting a pseudo-random code at a certain time, and the receiver also plays the same code without transmitting it. When the receiver picks up the code from the satellite it will lag behind the receiver’s own code a certain amount of time. Using this time, and knowing that the radio signal traveled at 300,000 kilometers per second, it can calculate distance to the satellite (Brain 1). Each distance from the receiver can be seen as a sphere of possible locations: the first two spheres would intersect to form a circle, this circle would intersect with the third sphere to make an arc, which would finally make a single point when it intersects with the fourth sphere.
Geologists use GPS for both surveying and continuous monitoring of areas. One of the reasons the GPS is such a valuable tool for geologists is that it can be accurate up to only millimeters of movement. Scientific GPS units are built to use a part of the code transmitted by satellites the civilian receivers do not pick up. This allows the scientific GPS units a much higher accuracy. Scientific GPS receivers pick up both the C/A code and a special P-code, and these codes are transmitted at different frequencies. This causes the receiver to eliminate errors caused by the signal being delayed as it travels through the atmosphere, one of the major sources of error for GPS (Brain 4).
Continuous monitoring using GPS has become widely used in the United States with the development of the Plate Boundary Observatory. The Plate Boundary Observatory is a project funded by the National Science Foundation and consists of 875 fixed GPS observatories throughout the Western United States (PBO mission statement). The observatory is designed to measure the three-dimensional strain occurring along the pacific and North American plate boundary (PBO mission statement). The advantage of using continuous monitoring with GPS is that the data can be analyzed to view surface deformation as a function of time, giving a clear picture of the changes taking place in the landscape (Dzurisin 102).
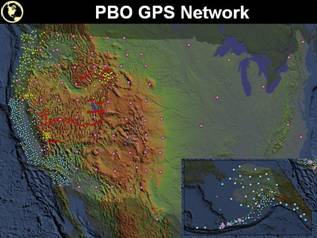
(bottom) PBO network of 875 GPS observatories (top) picture of GPS satellite constellation and orbitD. Seismic Monitoring
Another type of monitoring used by geologists is seismic monitoring. Volcanoes and earthquakes are very closely related and by studying the characteristics of earthquakes, geologists are better able to use data from seismic stations to predict eruptions. Earthquakes can be either short-period with high frequency, traveling deep in the earth, or long period with low frequency, traveling on the earth’s surface (Dzurisin 83). By measuring what type of earthquake is occurring, where it is occurring, how intense it is, and the interval between seismic events, geologists can use this information to predict the risk of eruptions in the area and to better understand plate movements. Seismic monitoring has the advantage of detecting seismic activity from kilometers away and is relatively easy to install and maintain (Dzurisin 83).II. Surveying techniques in Geological Monitoring.
Many of the techniques geologists use to monitor volcanic areas are done using surveys over set intervals rather than using continuous monitoring techniques. Electronic Distance Measurement (EDM), gas measurements, and GPS are all examples of surveys done by geologists.
A. Electronic Distance Measurement.
Electronic Distance Measurement is a commonly used method for measuring the horizontal slope distance of volcanoes. EDM is relatively inexpensive compared to GPS and it can be set up in dangerous areas with only one trip to install the reflector used by the system (DZURISIN 40). EDM works on a fairly simple method: A detector shoots some sort of monochromatic light, (for newer models a laser is used), then compares the reflected beams to the outgoing beams to measure the distance (40). Ideally, the set-up for EDM measurement would include multiple sites surrounding the volcano, each measuring the distance to several points on the volcano and each point being measured by at least two of the EDMs. It is also important to have a plane or helicopter fly over the area being measured to gauge the effects of the atmospheric conditions so that those effects can be calculated into the measurement (DZURISIN 40).
B. Gas Measurements Used in Volcanic Monitoring
Geologists measure gases from an array of sources. Geologists measure the gas emitted in a variety of volcanic areas. The chemical composition of the soil is of particular interest in volcanic areas. The chemical make-up of the hot springs nearby is often analyzed in the lab from field samples (Dzurisin 13). Also measured is the concentration and make up of gases emitted by the volcano (13). Geologists also use planes to fly through plumes of volcanic vents to measure the concentration of gases. This can be useful when an area is too dangerous for the geologists to go in person and run tests, and using a correlation spectrometer or COSPEC. (13). The gases that geologists are most interested in are sulfur dioxide (SO2), carbon monoxide (CO), hydrochloric acid (HCL), carbonyl sulfide (COS), and hydrogen fluoride (HF) (13). Geologists also can install continuous gas sensors to monitor for gases, which may only be emitted for a few minutes at a time (16). Through years of research, geologists can use this information gathered on gas emissions to better understand the processes at work in an active volcano and better monitor it for signs of eruption.C. Global Positioning System Surveys
GPS is not only used for continuous monitoring by geologists but is also used as a surveying tool. They use a simple set-up of two GPS units. One unit, called the rover, is set up a series of USGS markers to take the elevation and location of those points, while another, known as the base unit, is used to make the process more accurate. With a limited number of points, and less time spent reading the location when compared to a continuous monitor, the accuracy of a GPS survey is reduced. Because of this, geologists use a technique known as differential GPS in which a GPS unit is set up in a known location, it then receives its location from the satellites in orbit and calculates its error based on its known location and where the satellites position it. The GPS then sends these corrections to the rover as it makes its own calculations (Brain 5). Although it is less expensive to survey with GPS, because fewer GPS units are needed, it is also more labor intensive and must be done repeatedly in order to get a full picture of the deformation taking place.D. Interferometric Synthetic-Aperture Radar (InSAR)
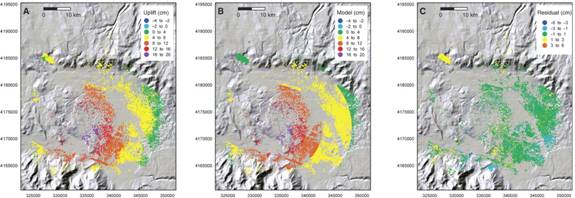
Interferometric Synthetic-Aperture Radar has developed as a very valuable tool for geologists. InSAR works by using synthetic aperture radar (SAR) which measures the difference in phase from the radio signal it emits to the signal it receives which in turn can be analyzed to give the distance to the ground and produce an image of an area 50-150km wide (Dzurisin 162). After taking two sets of data of the same area, an interferogram can be produced showing the differences in the two images and thus the deformation taking place (170). One of the advantages of InSAR is that it is transmitted from 108 to 1011 Hz, which produces wavelengths of 1-1000mm. The size of these wavelengths are not blocked by clouds which allows InSAR to work in almost any weather at any time of the day (Pritchard 68).
Modeling of deformation at Long Valley caldera from 1992-1999 using InSAR (Tizzan).III. Geological Monitoring in Long Valley Caldera
Long Valley is a great example of the application of different types of monitoring. GPS, InSAR, seismometers, leveling data, and EDM have all been used to collect data and better understand the processes at work in the area. For example, from 1975 to 2007 geologists used GPS, EDM, and leveling to record the uplift in the caldera (Tizzani). They hypothesized that this uplift must be caused by an intrusion of magma, an idea confirmed by the fact that the uplift was centered around the center of the resurgent dome, and the uplift actually preceded the earthquakes recorded by seismometers in the area (Tizzani). Then, using a combination of EDM, InSAR, GPS, and gravity measurements from 1992 to 2000, geologists were able to determine the intrusion to be a pipe-like body with a southwest-northeast orientation (Tizzani). Geological monitoring can also be used to mitigate hazards in the area. For example, in 1980, when the caldera was shown to have risen almost one foot since 1979, and almost two and a half feet by 2000. The USGS installed more sensors such as seismometers in order to better monitor the area as the unrest and potential danger grew (Hill).
Conclusion
Geologists have more ways than ever to monitor the changes taking place in volcanically active areas. New technologies, such as GPS and InSAR, are added to an ever growing knowledge base of how volcanoes work as well as older methods of monitoring such as geophones, tiltmeters, leveling, strainmeters, and gas measurements. Not only does this help geologists with data to compare to their complex computer models, but it also gives more ways than ever to detect impending volcanic events which may be harmful to human life and property.
Works Cited
Brain, Marshall, and Tom Harris. "How GPS Receivers Work." 16 June 2009 <http://electronics.howstuffworks.com/gadgets/travel/gps4.htm>.
Drezner, Jeffrey A., and Giles K. Smith. An Analysis of Weapon System Acquisition Schedules. Rand, 1990.
Dzurisin, Dan. "Tiltmeters and Tilt Measurements." 22 Sept. 2004. 16 June 2009 <http:/http://vulcan.wr.usgs.gov/Monitoring/Descriptions/description_tilt.html>.
Dzurisin, Dan. Volcano Deformation New Geodetic Monitoring Techniques. London: Springer-Verlag, 2002.
Hill, David P., Roy A. Bailey, Michael L. Sorey, James W. Hendley II, and Peter H. Stauffer. "Living With a Restless Caldera- Long Valley California." May 2000. 16 June 2009 <http://pubs.usgs.gov/dds/dds-81/Intro/facts-sheet/fs108-96.html>.
"PBO mission statement." 2 Oct. 2007. 16 June 2009 <http://pboweb.unavco.org/?pageid=53>.
Pritchard, Matthew E. "InSAR, a Tool for Measuring Earth's Deformation." July 2006. 16 June 2009 <http://www.geo.cornell.edu/eas/PeoplePlaces/Faculty/matt/vol59no7p68_69.pdf>.
Tizzani, P. "Uplift and magma intrusion at Long Valley caldera from InSAR and gravity measurements." Geology 37 (2009): 63.