Geology and Natural Heritage of the Long Valley Caldera
Carbon Dioxide Emissions on Mammoth Mtn: Causes, Characteristics, and Dangers
Kaleb Havens
Abstract
One of many smaller, less intuitive consequences of volcanic activity on a fault line is the emission of Carbon Dioxide gas being released from the ground. Pockets of carbon dioxide are trapped by layers of rock underneath the earth's surface, and when tectonic forces apply pressure to these cavities, they crack and allow the trapped CO2 gases to escape. In the case of Mammoth Mountain sitting on the edge of the Long Valley Caldera, the gas leaks out of the ground following along the major fault lines, most notoriously at Horseshoe Lake. The concentration of the gas varies, but it is more than enough in places to disrupt the growth and even kill some species of trees. Besides having an impact on wildlife, the gases of Mammoth Mountain have claimed the lives of many unprepared skiers, and even in 2006 members of the Mammoth Mountain Ski Patrol. These deadly effects require premeditated action by park security, as well consistent efforts to increase awareness among park patrons.
Causes
The carbon dioxide emissions near Mammoth Mountain are the result of volcanic activity along fault lines about three kilometers below the earth's surface [Prejan and Hill, 2005]. Pockets of CO2 gas are trapped under layers of rock beneath Mammoth Mountain , and when tectonic forces push magma up from underground, the lava forces a crack into the rock layers and allow the gases to escape in what Farrar et al. [2002] refer to as a “shallow dike intrusion.”
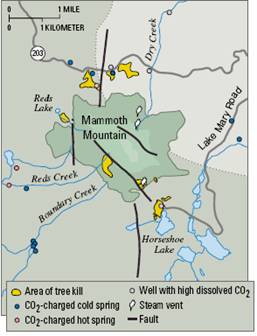
<- Fig 1
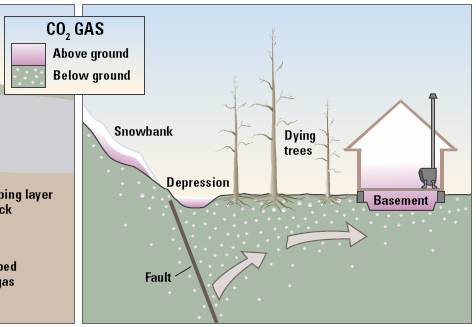
As illustrated in Figure 1 [ Figure adapted from Sorey et al. [1998]” (modified version)], once the carbon dioxide gas bursts out of its trapping layer, it follows the path of least resistance to the surface. Also pictured is Sorey et al.'s 1998 hypothesized dike, believed to be an additional cause the gas emissions in junction with magmatic pressures. Carbon dioxide gas has a density of 1.98 g/L, whereas normal atmosphere has about 1.2 g/L [Lewicki et al., 2008], meaning that the C02 gas settles around certain pockets once it reaches near the surface, whether at the roots of trees, under rock clusters, or settling in densely packed snow pockets. The gas travels upwards through nearby fault lines around Mammoth Mountain , as well laterally out through CO2 springs and ground water. Figure 2 delineates the outward flow points from a bird's eye view.
Fig 2 [ Figure adapted from Sorey et al. [2000] (modified version)].
The areas of CO2 emission concentration are oriented around major fault lines. The yellow areas of tree kill, most notoriously around Horseshoe lake, indicate a substantial carbon dioxide presence and, by extension, volcanic activity. The same techniques were used on Mt. Etna in Sicily and Mt. Kilaueau in Hawaii , and proved to be early warning signs of volcanic unrest in those areas. [Sorey et al., 2000].
Characteristics
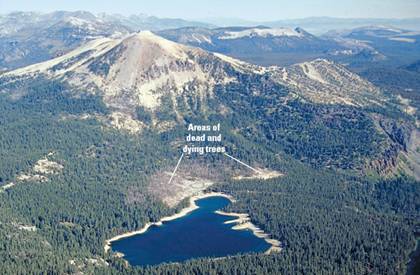
Hill and Prejan [2005] detail the progression of theories as to the cause of the tree killings when first noticed in 1990's, as scientists ruled out first the extensive droughts of the late 80's and then excluded insect infestation as a cause because of the rigidly-defined areas of tree death concentration. It wasn't until 1994 when soil measurements of the area where taken that geologists discovered a heavy concentration of Carbon Dioxide gases, ranging from 20%-90% in some areas. Sorey et al gave a revised estimate in their 2000 USGS article, corroborated by Farrar et al., [1999] ranging up to 95%; a typical amount of carbon dioxide is 0.1% for most wooded areas. ^ Fig 3 above is an aerial photo adapted from Sorey et al. [2005] showing the most extensive tree kill zone near Horseshoe Lake . Hill and Prejan [2008] outlined over 400,000 square meters of area on and around Mammoth Mountain in which trees were smothered by carbon dioxide. Basic botany teaches how plant leaves convert C02 into oxygen, but Sorey et al. [2005] explains that tree roots need to absorb oxygen directly. The carbon dioxide concentration interferes with this nutrient intake, and literally chokes the tree to death.
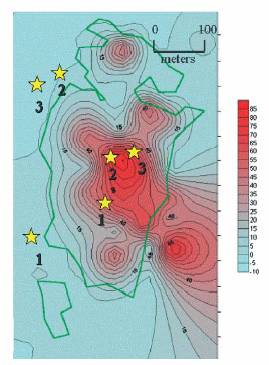
Among other repercussions of this magmatic gas emission is soil erosion. Stephens and Herring [2003] conducted an extensive study analyzing the depressed pH levels of the soil around Mammoth Mountain . Figure 4 [Stephens and Herring, 2003] to the right represents CO2 dispersal in the soil in the area surrounding Mammoth Mountain with red indicating a greater concentration. After testing the volcanic ash soil deposits, they determined that dissolution rates of the soil are independent of CO2 gas release; however, a significant correlation remains in the killing of trees. Their roots acted as anchors, holding the soil on the side of the mountain together. With widespread tree death in this area, the fine volcanic ash soil erodes much more quickly. Coupled with a change in the organic acid composition of the soil following the absence of conifer growth, the carbon dioxide emissions have had a clear impact on Mammoth Mountain 's terrain.
Farrar et al., [1995] originally overestimated CO2 concentrations, guessing up to 1200 tons/day were emitted by the mountain. However, Prejan and Hill [2006] solidified consensus, citing studies by Sorey et al., [1998] and Gerlach et al., [1999] and averaged their measurements to about 300 tons/day of CO2 emissions. Prejan and Hill's 2005 study revealed an additional 50 tons/day that flows out of CO2 springs around the Mammoth Mountain area ( Fig 2 ). These of course are averages, bound to increase during events such as the '97 earthquake swarm [Prejan and Hill, 2005] as well as standard increases and decreases of magmatic pressure from varying tectonic force [Sorey, 1998].
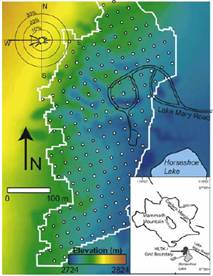
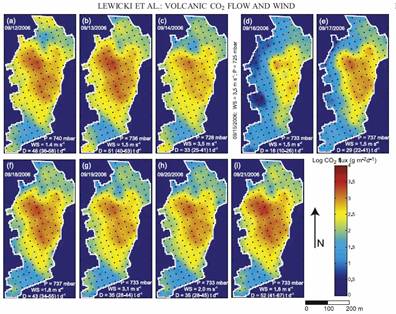
Sorey et al.'s 1998 hypothesis regarding the CO2 pocket beneath Mammoth Mountain was that, contrary to conventional logic, the reservoirs that these emissions stem from showed no sign of depleting. Prejan and Hill concluded the same in their 2005 study taking into consideration the preceding work of Sorey, Farrar, etc, showing no long term dispersal or diminishment of emissions on Mammoth Mountain. However, Lewicki et al.'s study conducted in 2006 “suggested a decline in CO2 emissions over decadal timescales,” and went on to show a decrease in CO2 emissions relative to elevation on or around Mammoth Mountain , with higher elevation emission zones diminishing first.
Fig 5 above and to the left shows a colorscale elevation of their test area in relation to horseshoe lake [Figure adapted from Lewicki et al. [2006] (modified version)]. Fig 6 to the right is comprised of daily colorscale graphs of their CO2 concentration findings [Figure adapted from Lewicki et al. [2006]” (modified version). by Lewicki's own admission [Section 4. Conclusions, Lewicki et al., 2006] these microscale timeframe findings are inconclusive except when considering the average discharge; 38 t d-1 versus Gerlach et al.'s 1998 findings of around 250 t d-1. This effectively refuted Prejan and Hill's 2005 studies, which to their credit was merely paraphrasing research that was almost a decade old and focusing on the larger matter of Mammoth Mountain 's magmatic properties. Lewicki et al.'s findings would prove good news indeed, if conifer growth was ever to return to Horseshoe Lake and the surrounding Mammoth Mountain area.
Yet, while there is widespread agreement with Farrar's '98 conclusion; “ . . . the CO2 emission is related to magmatic activity at depth, but at present it does not portend an imminent volcanic eruption,” because the emissions have lasted over an extended period of time, Sorey et al.'s findings in '98 still resonate; “If the total gas efflux rate at Mammoth Mountain is larger than the rate of supply to the reservoir, the high flow rates through the soil that have followed the 1989 intrusion can be expected to eventually decline. However, such a decline might also be effected by gradual closure of fractures by chemical sealing. In this case the intrinsic hazards would persist even after the diffuse flux disappears. The program of gas monitoring should therefore be maintained over the long-term.” This paints a grim lose-lose scenario for human presence on Mammoth Mountain ; even if volcanic activity subsists and the shallow dike intrusion does seal, the damage may be done and carbon dioxide presence on Mammoth Mountain may outlast any form of human intervention.
Dangers
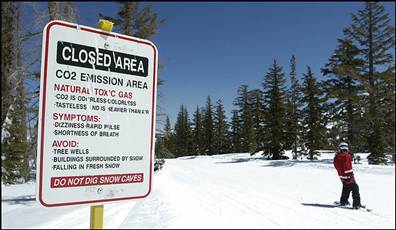
Long-term monitoring of the area has indeed commenced since the detection of CO2 emissions in 1994, but even keeping tabs on Mammoth Mountain has come at a high cost. On April 7 th , 2006, a snow cave claimed the lives not of wandering tourists, but of seasoned ski patrol veterans [Washington Post, 2006]. The hazardous area around Horseshoe lake is always clearly marked to ward off skiers and tourists [ Fig 7 above, Figure reproduced from Geis [2006] (exact reproduction)], but massive snowfall had covered the boundaries of the area. The patrolmen where engaged in an attempt to make the boundaries more visible in order to keep others safe from the dangers of co2 emissions. Seven other men were hospitalized for extensive CO2 exposure in an effort to rescue the victims. Carbon dioxide is volatile enough to our systems that even a 30% concentration of CO2 in the atmosphere can quickly cause unconsciousness and death, with little warning other than fatigue and lightheadedness, according to Sorey et al.'s USGS 2000 article. This puts any enclosed space above or below ground in a dangerous capacity if it happens to be around a known CO2 vent, as illustrated in Fig 8 below.
[Figure reproduced from Sorey et al. [2005] (exact reproduction)].
This threat to living things in the Mammoth Lake area has always been treated seriously by nearby communities and local safety enforcers such as the Ski Patrol. Warning signs surround the entire area and their vigilant upkeep is attested to by the sacrifice made by the three Ski Patrol members in 2006. As Sorey et al. mention in their 2005 article, snow packs in densely accumulated areas around Mammoth Mountain , posing hazardous obstacles to campers and wilderness hikers. Camping in these “snow caves” is ill-advised since CO2 levels may not be readily detectable, although long term exposure could cause death or lasting brain damage.
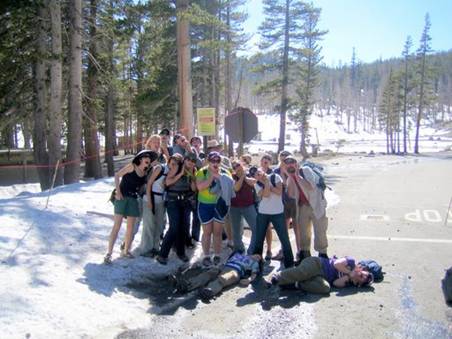
Fig 9 above; Indiana University students make light of the serious situation of CO2 emission on Mammoth Mountain . [Figure reproduced from Hamburger et al. [2008] (exact reproduction].
Conclusions
First detected in 1994 and having been a destructive force on Mammoth Mountain's Ecosystem since 1989, carbon dioxide emissions from these outlying faults along the Long Valley caldera have been signs of the area's still active volcanic forces, as well as an agent of nature to which human and wildlife alike have had to adapt. Having decimated the canopy and taken the lives of many public servants, even if the emissions do eventually decrease in intensity until the subterranean reservoir is depleted, the effects may not be as dependant on a steady stream of underground gas as scientists originally thought. That coupled with the remote yet possible eventuality of other increases in volcanic activity, either case of carbon dioxide presence warrants constant monitoring by geological professionals and field agents to make periodic determinants on the state of Mammoth Mountain and its gas emissions.
Works Cited
Farrar, Christopher D., John M. Neil, and James F. Howle. Magmatic Carbon Dioxide Emissions At Mammoth Mountian . U. S. Geology Survey. Sacramento, CA : U.S. Government Printing Office, 1999. 1-31.
Farrar, C D., M L. Sorey, W C. Evans, J F. Howle, B D. Kerr, B M. Kennedy, C Y. King, and J R. Southon. "Forest-Killing Diffuse CO2 Emission At Mammoth Mountain as a Sign of Magmatic Unrest." Nature 376 (2002): 675-678. 12 June 2008.
Geis, Sonya. "3 Die From Toxic Gases At California Ski Resort." Washington Post 8 Apr. 2006. 5 June 2008 <http://www.washingtonpost.com/wp-dyn/content/article/2006/04/07/AR2006040701737.html>.
Gerlach, T M., K A. McGee, T Elias, A J. Sutton, and M P. Doukas. "Carbon Dioxide Emission Rate of KiLauea Volcano: Implications for Primary Magma and the Summit Reservoir." JOURNAL OF GEOPHYSICAL RESEARCH 107 (2002). 12 June 2008.
Hill, David P., and Stephanie Prejean. "Magmatic Unrest Beneath Mammoth Mountain , California ." Journal of Volcanology and Geothermal Research 146 (2005): 257-283. 5 June 2008.
Lewicki, J L., G E. Hilley, T Tosha, R Aoyagi, K Yamamoto, and S M. Benson. "Dynamic Coupling of Volcanic CO2 Flow and Wind At the Horseshoe." GEOPHYSICAL RESEARCH LETTERS 34 (2007): 1-5. 5 June 2008.
Sorey, M L., W C. Evans, B M. Kennedy, C D. Farrar, L J. Hainsworth, and B Hausback. "Carbon Dioxide and Helium Emissions From a Reservoir of Magmatic Gas Beneath Mammoth Mountain , California ." Journal of Geophysical Research 103 (1998): 15,303-15,323. 12 June 2008.
Stevens, Jennie C., and Janet G. Hering. "Factors Affecting the Dissolution Kinetics of Volcanic Ash." Applied Geochemistry 19 (2004): 1217-1232. Science Direct . 5 June 2008.