Geology and Natural Heritage of the Long Valley Caldera
Methods of Volcano Monitoring To Predict Likelihood of Eruption in Long Valley Caldera
Jordan Centers
Abstract
Volcano monitoring uses knowledge of volcanic processes and extensive data gathering to analyze areas of volcanic activity. The main goal is to learn the nature of the volcano, the magmatic processes occurring, and the likelihood of a future eruption. Volcano monitoring centers around three aspects of volcanic processes: ground deformation, seismic activity, and gas emissions. These techniques are used to assess the present volcanic situation in the Long Valley Caldera. Even though many advances have been made in this field, it is still difficult to pinpoint eruptions on a human time scale when volcanic activities are so complex and occur over a large geological time scale.
One method of monitoring volcanoes is measuring ground deformation. Ground deformation is defined as the “change of shape of the ground surface due to an applied force” (“Yellowstone InDepth”). This force is the movement of magma beneath the earth's surface. Magma rises from the mantle because it is molten rock and therefore less dense than the solid rock of the mantle and crust. Typically, it accumulates into a large magma chamber relatively close to the earth's surface. (Marshak, 2004). As the magma builds up in the chamber, it places massive amounts of pressure on the surrounding rocks, and as a result these rocks are pushed upwards and outwards as shown in Figure 1 (“Volcano Monitoring Techniques”). Measuring these changes in topography is one way that scientists can become familiar with the dimensions of a magma chamber.
The oldest and simplest methods of measuring ground deformation are electronic distance meters (EDM) and tiltmeters. As explained earlier, the pressure from a magma chamber pushes overlying rock up and outwards. Electronic distance meters measure the distance between two benchmarks. An EDM sends an electromagnetic signal to a reflector and then receives the signal back. It records the difference in phase between the two signals and can thus determine distance within a few millimeters (“Using Electronic Distance Meters,” 2001). Analysis from EDMs is limited because it can only determine changes within the benchmarks. Also, changes in topography are most likely not going to be uniform between two benchmarks, and solely using EDMs will not be able to determine where the most change is occuring.
Figure 1. A) Picture of a magma chamber and volcano. B) Picture of what happens when magma chamber inflates. The tilt steppens and vertical height increases and the horizontal increases at a smaller magnitude. Figure reproduced from Volcano World (exact reproduction)
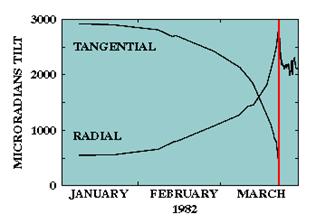
Not only can changes in topography be analyzed by measuring horizontal and vertical changes, but it can also be analyzed by measuring slope. As a volcanic dome grows larger, the relief between the top of the dome and the bottom will increase, and so will the slope as shown in Figure 1. Tiltmeters are instruments that measure slope and they are extremely precise. Tiltmeters were used to accurately predict the effusive eruptions of Mount St. Helens between 1980 and 1986. According to Figure 2 on the next page, approximately three months before an eruption, the tilt gradually started to increase, but then accelerated a few weeks before the eruption. Since the eruptions and preceding tilt changes followed a certain pattern for each eruption and since scientists were able to track this pattern, scientists were able to predict eruptions up to about 2-4 weeks before an eruption (“Tiltmeters,” 2001).
Figure 2. This graph shows the radial and tangential tilt three months before the March 1982 eruption just less than 200m north of the dome. Figure reproduced from Tiltmeters [2001] (exact reproduction).
GPS is a relatively new surveying technique that is quickly replacing EDMs because of its accuracy and simplicity. It can measure both horizontal and vertical positioning, it requires no line of sight between benchmarks, can be left unattended, can transmit data in real time, and its accuracy lies within several millimeters (“Using GPS,” 2001). One requirement of GPS receivers is that they need a clear view of the sky because GPS systems must receive signals from at least 4 GPS satellites. The satellites have an extremely precise internal clock, which records the exact time it sends a signal. The receivers record the time it receives the signal, and the difference in time between the receiver and the four satellites can give the receiver's position in three dimensions (“How Does GPS Work?,” 1998).
Interferometric Synthetic Aperture (InSAR) is a very new and popular ground deformation monitoring technique. InSAR uses radar satellites that constantly shoot radar waves. The radar waves hit the earth and reflect back and then the satellites receive the wave again. Each image records the intensity and the phase of the wave. The intensity refers to how much of the image is left after the wave travels to the earth and back. Therefore the intensity depends on the distance between the satellite and the location on earth, because the farther the distance the more time there is for the wave to be absorbed by the atmosphere. The intensity also depends on how much has been reflected back in the direction of the satellite. The phase of the satellite records the time it took the image to travel from the satellite to the earth. Every point in an image records the intensity and the phase. Any change between two images of the same location on earth will reveal any minute changes in topography. InSAR is highly useful because it “produces a spatially complete map of ground deformation,” as opposed to past techniques that could only take measurements at certain benchmarks (“What is InSAR?,” 2005). InSAR is becoming incorporated into the study of more deformation from earthquakes and around volcanoes. One example is Westdahl volcano an active stratovolcano in Alaska . At Westdahl, InSAR was able to identify about 17cm of fairly uniform inflation from September 1993 to October 1998. Further modeling based on this data indicated that the source of inflation is about 9km below the center of the volcano and that the inflation of the volcano corresponds to an inflation of approximately .05km 3 of the source from 1993 to 1998. This led scientists to predict in 1999 that the volcano could erupt within “the next several years” (Lu et al., 2000).
Along with ground deformation, another geologic sign of volcanic activity is earthquakes. Earthquakes are caused by the pressure that rising magma exerts on surrounding rock, which causes rocks to fracture (“Monitoring Volcano Seismicity,” 2000). Based on research at numerous volcanoes, scientists now know the meaning of different seismic patterns. Earthquakes of a higher, but also more variable, magnitude are called volcano-tectonic earthquakes and are common several weeks to months before an eruption. These earthquakes are caused by stresses on rock, which are typically caused by slip on faults or fracturing as a result of magma movement. Long period earthquakes and volcanic tremors are low frequency earthquakes that are most often associated with oscillations in rock-fluid systems. Long period earthquakes are “considered the best sign of an impending eruption” as they usually only occur hours to days before an eruption (Burlini).
The measurement of earthquakes is largely done by seismographs. Seismographs measure ground vibrations and are extremely sensitive. They are able to record relative motion through the use of a heavy weight. This heavy mass has inertia so that it will remain stationary during an earthquake. It has a recording device attached to it so that it can record motion onto some object that is moving with the ground. (“FAQ-Seismographs,” 2008). Since long period earthquakes—which are often times indicative of eruptions—have very low magnitudes, there must be a network of seismic stations in order to detect these small earthquakes (“Monitoring Volcano Seismicity,” 2000). For example the Long Valley caldera has a network of 18 seismic stations within the caldera and 20 stations within 50km of the caldera boundary (“Monitoring of the LVC,” 2003).
Since the onset of long period earthquakes provides only limited response time (a few days to hours), more research is being done on volcano tectonic earthquakes in hopes for earlier warning signs. However, this may be difficult because volcano-tectonic earthquakes can occur as a result of magma pressurizing rock and fracturing it, or it can occur when magma recedes and rocks move in to fill where the magma previously was. Since these are not indicative of restless eruptive activity, there may be an ambiguity to whether a certain set of volcano-tectonic earthquakes correspond to eruptive activity or not (Roman, 2006).
Volcano-tectonic earthquakes were studied at Soufriere Hills Volcano, Montserrat . Here the Montserrat Volcano Observatory (MVO) emplaced an extensive digital seismic network and one study analyzed the changing orientation of the fault in order to help predict eruptions. The study found that the fault-plane orientation changed from the NE-SW direction in normal times to NW-SE direction weeks to months before the beginning of eruptive activity. The fault plane changed before three different eruptions from June 1997 to August 2005. The study believes that the NW-SE plane occurs because of “stresses induced by the inflation of a NE trending dike or system of dikes beneath the vent.” The greatest significance of this study was that the changing plane orientation was the only monitoring technique that showed a change in volcanic activity. Ground deformation, sulfur dioxide emissions, and volcano-tectonic activity had remained elevated after the first eruption and therefore significant changes could not be detected before the second eruption (Roman, 2006). Another significance was that this technique could provide warning of several weeks.
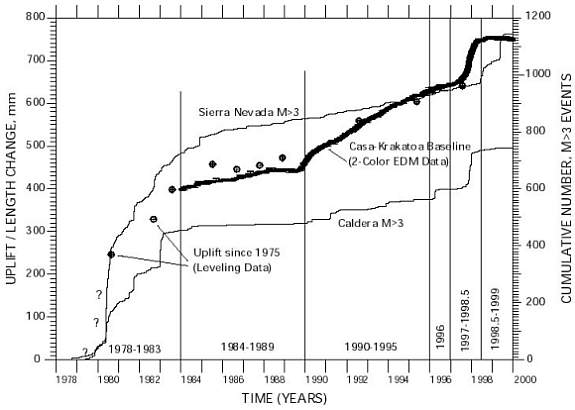
More likely than not there is going to be more than one warning sign of activity at a time. Volcanic activity in the Long Valley Caldera is a great example. Since 1978, LVC has had periods of earthquake swarms accompanied with uplift of the resurgent dome (See Figure 3 on the next page). The earthquake swarm with the highest overall intensity was in January 1983. There were two 5.3 magnitude earthquakes and a slew of smaller ones, and during this time the resurgent dome had uplifted 7cm. USGS scientists have concluded that the source for the deformation and earthquake activity is a magma reservoir about 7-12km beneath the resurgent dome. Most of these earthquakes are “generated by slip on a series of near-vertical, west-northwest striking faults” within the South Moat Seismic Zone (SMSZ) and N-NE faults to the south of the caldera in the Sierra Nevada (Hill et al., 2001). This geometrically corresponds to extensional movements with the SMSZ moving E-NE relative to the Sierra Nevada . So in this case pressure from the magma chamber is creating even more movement along the extensional faults that are present in the caldera. However, based on the quantity of earthquakes in the region, especially in the SMSZ, scientists concluded that the magma chamber under the resurgent dome could not be the sole source responsible for all the earthquakes. Therefore, they concluded that there must be another source under SMSZ but most likely at a significantly greater depth. Monitoring will need to continue at these places in order to follow any changes in seismic activity and to be on alert for any abnormalities (Hill et al., 2001).
Figure 3. This graph shows the uplift of the resurgent dome measured first by leveling surveys and then EDMs. The uplift corresponds to the number of earthquakes greater than magnitude 3 both inside the caldera and to the south of it on the Sierra Nevada . Figure reproduced from Hill et al. [2001] (exact reproduction).
Besides earthquake and ground deformation patterns, another warning sign of volcanic activity is changing gas emissions. Magma is able to hold gas because the increased pressure at lower depths increases the gas solubility of the magma. As the magma chamber pushes upward, the overlying rock becomes thinner and thus the pressure decreases. As the pressure slowly decreases, gases are released. These gases can escape to the earth's atmosphere through fumaroles, active vents, and porous ground. The detection of these gases can be effectively monitored in order to keep track of activity.
Not only can gas emissions be indicative of a magma source, but they pose a great danger. First, magmas that have a high gas content correlate to explosive eruptions and, second, many gases are harmful to humans and the atmosphere. Therefore it is an important component to test, however, it can be very difficult. Regular testing can be time consuming and difficult if the volcano lies in a remote location. Also many gases dissolve easily in water, therefore gas measurements could understate the actual amount of gas emissions. Gas sampling can be taken of the atmosphere, soil, and water (“Monitoring Volcanic Gases,” 2000).
Mammoth Mountain has had a lot of attention for gas monitoring research in recent years. An 11-month earthquake swarm starting in 1989 and the subsequent discovery of carbon dioxide emissions and tree-kill areas triggered interest. Seismic stations were set up and gas sampling began. Atmospheric testing is concentrated at three fumarolic areas. Soil sampling is concentrated within and around tree-kill areas, which lie in seven different locations around Mammoth Mountain . Water from nine cold springs was also sampled and tested (Sorey et al., 1998).
Extensive research shows that the gas composition between the fumarolic vents and soil is consistent, therefore it was concluded that it came from the same source. Scientists conclude that the source is a gas reservoir in highly fractured rock and is sealed by an impervious rock. The intrusion of a dike in 1989 and an associated earthquake swarm, pushed gas past the cap. In addition to the earthquake swarms and gas emissions, there have been episodes of long period earthquakes. The earthquake swarm occurred at shallow depths (about 10km) and is associated with the same intrusion as the gas emissions. Starting in July 1989, three months after the earthquake swarm, long period earthquakes started occur at focal depths between 10 and 25km. The lower depths correspond to a more ductile rock and therefore earthquakes with a lower frequency. These long period earthquakes are a result of basaltic dikes at mid-crustal depths (Sorey et al., 1998).
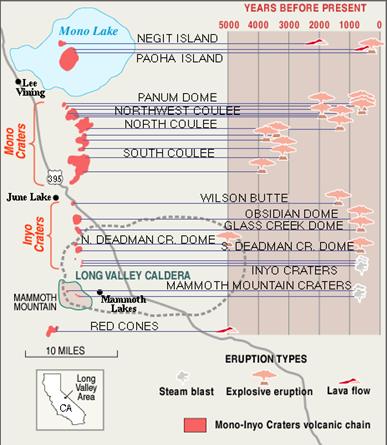
Figure 4. This diagram gives a rough map of the Mono-Inyo chain and to the right it gives the age and type of eruption that occurred. Figure reproduced from Future Eruptions [2004] (exact reproduction).
Now that each monitoring technique has been explained, the Long Valley situation can be examined to determine the likelihood of future eruptions. The resurgent dome, south moat seismic zone (SMSZ), and Mammoth Mountain have already been examined. And although there has been recent volcanic activity, the chances of an eruption occurring at any specific time is small. However, this could easily change with new discoveries or restless activity. It is more likely that a future eruption will occur along the Mono-Inyo craters chain (“Future Eruptions,” 2004). The Mono-Inyo craters have a north/south orientation with the Inyo craters inside the Long Valley Caldera and the Mono craters to the north. The Mono-Inyo craters have been erupting for about 2-3,000 years at roughly 500 year integrals (See Figure 4). The last eruption was about 500-600 years ago at Panum Crater, the northernmost crater along the chain (Hill et al., 2001). By studying these volcanoes and the types of eruptions, the public can best prepare for a future eruption.
Before discussing the past eruption patterns of the Mono-Inyo chain, the different types of magma that produce different types of eruptions must be examined, because this will determine what type of an eruption the public must prepare for. Rhyolitic (about 70% silica) magma has a high viscosity because the silicon-oxygen tetrahedra that make up the magma link together in long chains and thus it is more resistant to flow. Mafic (about 50% silica) magma has a lower viscosity and are able to move more easily. Rhyolitic magmas can also hold more gases because of their higher viscosities. These two aspects make a volcanic eruption with rhyolitic magma explosive, and therefore they deserve more attention when speaking of volcanic hazards (Marshak, 2004). Contrastly, mafic magma sources correspond to strombolian eruptions and lava flows. Strombolian eruptions spew out tephra but relatively close to the vent. Lava flows can travel for a few kilometers, but they travel at relative slow rates, usually around 10 miles per hour (Hill et al., 2001). Lava flows can certainly destroy buildings, but typically they move at a slow enough rate where evacuation is possible and damage is minimal.
The tephra deposits from the Mono craters and South Deadman, Glass Creek, and Obsidian Dome are mostly rhyolitic and rhyodacitic. This corresponded to explosive eruptions in the past 40,000 years producing pyroclastic flows and ashfall. The first eruptions of the Inyo Craters were phraetic eruptions. In phraetic eruptions, magma heats underground water and then a depressurizing of some sort (usually through earthquakes), turns the liquid water to steam and thus an explosion ensues. The source of these eruptions was an intrusion by a north/southward feeder dike and this same source also led to explosive eruptions at South Deadman, Obsidian, and Glass Creek domes. These explosive eruptions consisted of pyroclastic flows, ashfall, and other airfall deposits. South Deadman vent has pumice and ash deposits 12km away to the northeast, because of the prevailing wind shown in Figure 5. South Deadman vent also has pyroclastic flow deposits 6km away. There were also lava flows after the explosive eruptions. However, when it comes to discussing volcanic hazards, explosive eruptions take much higher precedence for obvious reasons (“Eruptions from Inyo Chain,” 2001).
Figure 5. This is a map of the volcanic deposits of the South Deadman vent. The purple lines show pyroclastic flow deposits and the blue lines show airfall deposits. Figure reproduced from USGS Long Valley Observatory, Eruptions From the Inyo Chain [2008] (exact reproduction).
In the mid-1980s scientists drilled about 600m deep into South Inyo crater. The drill made it through highly fractured rock and then reached the top of a dike where magma had frozen. One possible explanation for why the magma did not reach the earth's surface is that it had come into contact with groundwater and then instantaneously frozen. The highly fractured rock could be evidence of subsurface explosions where the groundwater coming into contact with the hot magma suddenly “flashes” from hot, pressurized water to steam. The fracturing of this rock also helps scientists to examine the nature of the earthquakes that were caused by the dike intrusion (“Eruptions from Inyo Chain,” 2001).
If another eruption were to take place in the Long Valley Caldera it will most likely be along the Mono-Inyo chain. Even though an eruption along the Mono-Inyo chain is predictable, the probability of an eruption occurring in any given year is still only .05% (Hill et al., 2001). The eruption would most likely follow the patterns of the past Mono-Inyo eruptions. There is a good possibility that the initial eruption would be a phraetic one, followed by the explosive eruptions and lava flows. The extent of the eruption is dependent upon the volume of magma in the dike. Although, the eruptions along the chain have been explosive, they have been relatively small. Therefore, the people living within close proximities of the chain (tens of kilometers) should be aware of the volcanic area they live in.
ReferencesBurlini, L., Vinciguerra, S., Di Toro, G., De Natale, G., Meredith, P., & Burg, J.P. (2006, Oct. 4) Seismicity Preceding Volcanic Eruptions: New Experimental Insights [Electronic Version]. Geological Society of America Journal, 35(2), 183-186.
Eruptions from the Inyo chain about 600 Years Ago: Sequence of Events and Effects in the Long Valley Area. (2001 Jan. 03). USGS Long Valley Observatory. Retrieved June, 12, 2008, from http://lvo.wr.usgs.gov/InyoEruption/index.html
FAQ—Seismographs. (2008, January 25). USGS Earthquake Hazards Program. Retrieved June 9, 2008, from http://earthquake.usgs.gov/learning/faq.php?categoryID=7&faqID=104
Future Eruptions in California 's Long Valley Area—What's Likely?. (2004, Oct. 14). USGS. Retrieved June 11, 2008, from http://pubs.usgs.gov/fs/fs073-97/
Hill, D.P., Dzurisin, D., Ellsworth, W.L., Endo, E.T., Galloway , D.L., Gerlach, T.M., et al. (2001). Response Plan for Volcano Hazards in the Long Valley Caldera and Mono Craters Region, California . USGS. Retrieved June 8, 2008, from https://oncourse.iu.edu/access/content/group/SP08-BL-GEOL-G190-7854/Final%20project%20resources/USGS_ResponsePlan.pdf
How Does GPS Work?. (1998). Smithsonian Institution. Retrieved June 9, 2008, from http://www.nasm.si.edu/gps/work.html
Lu, Z., C. Wicks, D. Dzurisin, W. Thatcher, J. T. Freymueller, S. R. McNutt, and D. Mann (2000), Aseismic Inflation of Westdahl Volcano, Alaska, Revealed by Satellite Radar Interferometry , Geophysical Research Letters , 27 (11), 1567–1570.
Marshak, S. (2004). Up from the inferno: Magma and igneous rocks. In Earth: Portrait of a Planet (pp. 143-147). New York : W. W. Norton & Company.
Monitoring of the Long Valley Caldera and the Mono-Inyo Craters Volcanic Chain. (2003, Dec 21). USGS Volcano Hazards Program—Strategy for Reducing Volcanic Risk. Retrieved June 9, 2008, from, ) http://lvo.wr.usgs.gov/monitoring/index.html#earthquake
Monitoring Volcanic Gases: The Driving Force of Eruptions. (2000, Aug 05). Volcano Hazards Program—Strategy for Reducing Volcanic Risk. Retrieved June 12, 2008, from http://volcanoes.usgs.gov/About/What/Monitor/Gas/GasMonitor.html
Monitoring Volcano Seismicity. (2000, Nov 14). USGS Volcano Hazards Program—Strategy for Reducing Volcanic Risk. Retrieved June 9, 2008, from http://volcanoes.usgs.gov/About/What/Monitor/Seis/SeisMonitor.html
Roman , D.C. , Neuberg, J., & Luckett, R.R. (2006, Aug. 15). Accessing the Likelihood of Volcanic Eruption Through Analysis of Volcanotectonic Earthquake Fault-Plane Solutions. Earth and Planetary Science Letters, 248(1-2), 244-252.
Sorey, M.L., Evans, W.C., Kennedy, B.M., Farrar, C.D., Hainsworth, L.J., & Hausback, B. (1998). Carbon Dioxide and Helium Emissions from a Reservoir of Magmatic Gas Beneath Mammoth Mountain , California [Electronic Version]. Journal of Geophysical Research, 103(B7), 15,303-15,323.
Tiltmeters Help Scientists Predict Eruptions at Mount St. Helens . (2001, May 01). USGS Volcano Hazards Program—Strategy for Reducing Volcanic Risk. Retrieved June 9, 2008, from http://volcanoes.usgs.gov/About/What/Monitor/Deformation/TiltMSH.html
Using Electronic Distance Meters to Measure Volcano Deformation. (2001, May 01). USGS Volcano Hazards Program—Strategy for Reducing Volcanic Risk. Retrieved June 9, 2008, from http://volcanoes.usgs.gov/About/What/Monitor/Deformation/EDM.html
Using the Global Positioning System (GPS) to Measure Deformation on Volcanoes. (2001, May 01). USGS Volcano Hazards Program—Strategy for Reducing Volcanic Risk. Retrieved June 12, 2008, from http://volcanoes.usgs.gov/About/What/Monitor/Deformation/GPS.html
Volcano Monitoring Techniques. Volcano World, University of North Dakota . Retrieved June 7, 2008, from http://volcano.und.edu/vwdocs/vwlessons/monitors.html
What is InSAR? (2005). USGS Earthquake Hazards Program— Northern California . Retrieved June 9, 2008, from http://quake.usgs.gov/research/deformation/modeling/InSAR/whatisInSAR.html
Yellowstone InDepth: An official web feature of yellowstone national park. National Park Service, Department of the Interior. Retrieved June 9, 2008, from http://www.nps.gov/archive/yell/yellowstoneindepth/episode1glossary.htm