Geology and Natural Heritage of the Long Valley Caldera
Volcanic Hazards
Elizabeth Bell
Abstract
Volcanic eruptions involve a series of events, each of which pose possible hazards (directly and indirectly) to the environment, property, and all living things. By using technologically advanced monitoring systems, scientists are able to record gas emissions, ground deformation, and other events related to volcanic unrest. This monitoring helps to predict future volcanic eruptions and aid in other mitigation processes.
Introduction
Long Valley Caldera, located between the Sierra Nevada Mountain range and the Basin and Range Province of California, was the site for one of the most catastrophic volcanic eruptions in North American history 760,000 years ago. Many of the volcanic deposits from this eruption can still be found in that area today. These deposits give clues to geologists about what events happened in the past and help to determine what future eruptions might have in store for us.
Based on the evidence found in and around Long Valley Caldera, one can infer that the eruption 760,000 years ago, like many other eruptions, probably included a series of events. These hazardous events could have involved gas emissions, vog and acid rain, tephra and volcanic ash falls, lava flows, and/or pyroclastic flows. Often, natural disasters such as earthquakes, lahars, and tsunamis can be directly or indirectly related to a volcanic eruption as well.
Types of Volcanic Hazards
Gases
In 1983, the Hawaiian volcano known as Kilauea began erupting. This effusive eruption involved spectacular lava fountains and flows which helped to make Kilauea a popular tourist destination. However, in 1986, Kilauea 's eruption style changed from sporadic lava fountains to continuous outflows of lava and gas. During periods of sustained eruption, Kilauea can emit up to 2,000 tons of sulfur dioxide per day. According to the Environmental Protection Agency, sulfur dioxide is a gas that dissolves easily in water vapor to create acid and can mix with other gases and particles in the air to produce sulfates which can be harmful to people and the environment [EPA, 1997]. While Kilauea's eruption style is much different than the eruptions found at Long Valley , it is safe to say that a fair amount of sulfur dioxide could be present near the more active volcanic regions of Long Valley Caldera.
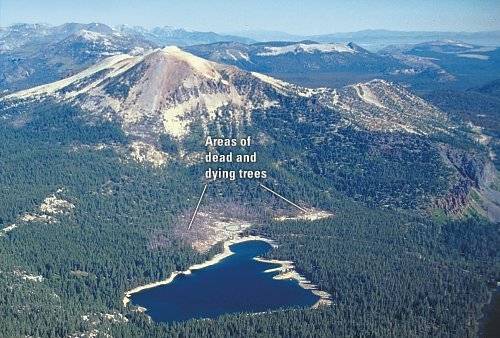
Although abundant, sulfur dioxide is not the only volcanic gas that poses a threat to people, livestock, plants, and the environment. Carbon dioxide commonly seeps from active volcanoes through the ground as pressure inside the volcano decreases from rising magma. Because carbon dioxide is heavier than air, it gets trapped in low-lying and enclosed areas. When the concentration of carbon dioxide in an area reaches about 30%, its effects can be deadly [Hathaway et. al., 1991]. Horseshoe Lake in Mammoth, CA. is a prime example of the amount of destruction high carbon dioxide levels can cause.
In 1990, U.S. Forest Service rangers noticed large areas of dead trees on the side of Mammoth Mountain near Horseshoe Lake . Because this was a year after a swarm of earthquakes disrupted the Long Valley area, USGS inferred that the dead trees were a sign of high carbon dioxide levels in the ground, which could have resulted from rising magma in the volcano. Plants use carbon dioxide in their leaves during photosynthesis, but when the carbon dioxide is absorbed through their roots, the trees die. Since 1990, more than 150 acres of trees have died around Mammoth Mountain [Hill, 2006]. In recent years, skiers have also lost their lives after falling into snow pits where carbon dioxide accumulated and reached hazardous levels.
Figure 1 Tree kill area of Mammoth Mountain where over 150 acres of trees have died due to high concentrations of carbon dioxide in the soil. Figure reproduced from [USGS F.S.172-96, 2007] (exact reproduction).
Vog and Acid Rain
Vog (volcanic smog) is a visible haze that is composed of moisture, volcanic gases, aerosol (sulfuric acid and sulfates) and sometimes toxic metals such as selenium, mercury, arsenic and iridium [USGS- F.S.169-97, 2000]. The main problem associated with vog is that it greatly decreases visibility. Often, aircraft encountering vog mistake it for a weather cloud. The difference between the two is that vog contains many particles that can severely damage an aircraft, possibly resulting in a crash. Sulfates contained in the vog can also cause health concerns such as difficulty breathing, headaches, flu-like symptoms, and increased difficulties associated with heart disease [ASTDR, 1998]. Vog is most commonly associated with the volcanoes in Hawaii .
In addition to vog, acid rain (sulfur dioxide + water) can have many negative effects on the environment, plants, and people. When moisture is present, sulfuric acid droplets are highly corrosive and destroy metal objects and plants. For people who depend on rooftop rain water for drinking and household uses, acid rain can pose huge threats including lead poisoning (from lead leached from rooftops) and lack of drinkable water. When moisture is not present, sulfur dioxide can impede rainfall. This also has a negative impact on vegetation.
Tephra and Ash Fall
Volcanic eruptions are usually preceded by large eruption clouds containing tephra. Tephra is a general term that refers to any size, shape, or composition of volcanic rock fragment. Depending on the type of eruption, tephra may include pumice, glass shards, or rock fragments of various forms (ie. igneous, sedimentary, or metamorphic). The smallest type of tephra, volcanic ash (< 2mm), can travel thousands of kilometers away from a volcanic vent [USGS- Hazards: Tephra, 1999]. The direction of travel is hugely dependent on wind direction. Areas downwind of an eruption can be greatly affected by ash deposits. Ash fall deposits have been shown to turn day into complete darkness, destroy homes and property, and disrupt aircrafts. Larger fragments of tephra such as lapilli (2-64 mm) and bombs (>64 mm) usually travel less distance but can cause damage as well.
Lava Flow
After tephra is expelled from the vent of the volcano, enough pressure has been decreased that the molten rock magma from beneath the Earth's crust is able to rise. Once the magma reaches the surface, it is called “lava”. The rate of flow of the lava is largely dependent on silica content as well as the steepness (grade) of the ground, the way it flows (sheet, channel, tube), and the rate of lava production. Lava that contains less silica, such as basalt, flows easily. This type of eruption is considered to be “effusive” and can flow away from the volcanic vent at about 10-30 kilometers per hour. Viscous (high silica content) lava flows are less of a direct threat to the people in the surrounding communities because they can easily be avoided. This thick, siliceous magma generally flows less than 3 kilometers per hour and rarely extends more than 8 kilometers from the volcanic vent [USGS- Lava Flows, 2000].
Although people can usually escape lava flows, everything else in the path of the lava will be destroyed. Lava is so hot that anything it touches immediately bursts into flames. If lava reaches water, many other disasters such as tsunamis, explosions, and lahars can occur.
Pyroclastic Flows
Even high silica lava that forms domes or vertical eruption columns of ash can pose threats to people and property if the dome or the column collapses. This collapse can generate a pyroclastic flow, traveling around 80 kilometers per hour and reaching temperatures between 300 and 800 degrees Celsius [Scott, 1989]. Pyroclastic flows involve two parts: a) a surge of hot debris, and b) a turbulent surge of ash. These flows are highly destructive and possibly the most harmful part of a volcanic eruption, especially in localized areas downwind of the volcanic vent. Pyroclastic flows are capable of destruction by direct impact, burying sites with debris, burning land and buildings, or even triggering lahars by melting snow. Pyroclastic surges are related, although they are typically less dense than pyroclastic flows, and can be hot or cold.
A famous example of pyroclastic flow deposits can be found in and around the Long Valley area. The Bishop Tuff refers to pyroclastic ash and flow deposits from the Long Valley eruption 760,000 years ago. The deposits are around 200 meters thick and cover an area of about 2,200 square kilometers [USGS- Bishop Tuff, 1999]. Some of the ash deposits appear to have traveled as far as Nebraska . The bottom portion known as “welded tuff” is mostly comprised of air fall deposits such as pumice and ash. This section was compressed by heavier and denser pyroclastic flow deposits.
Figure 2 Shows the Bishop Tuff. Two distinct layers can be seen: the top (5 meters) comprised of dense pyroclastic flow deposits and the bottom (5-6 meters), containing pumice and ash deposits. Figure reproduced from [USGS-Bishop Tuff, 1999] (exact reproduction).
Lahars
Pyroclastic flows and surges often trigger lahars (mudflows). The lahars can be a result of three different scenarios: a) by blocking tributaries or streams, allowing water to pool and mix with debris and later rush downstream, b) by melting snow and ice, leading to torrents of rushing water, or c) indirectly causing erosion and floods through subsequent rainstorms.
In 1991, the eruption of Mt. Pinatubo led to a pyroclastic flow that blocked a major tributary. During the monsoon season of 1994, a large lake began to form behind the blockage. As water accumulated, the blockage of sediment broke and the water was released. Over night, the town of Bacolor was buried in 5 to 10 meters of sediment and 25 people lost their lives [ USGS- Lake lahar, 1999].
Monitoring
Within the Long Valley area, scientists are keeping a close eye on the volcanic activity. In order to understand what hazards may be presented in the future, the United States Geological Survey (USGS) is currently monitoring earthquake activity, deformation, hydrological activity, and gas emission. Through the data collected by monitoring, scientists can determine whether or not the unrest involves movement of magma, when an eruption is likely to occur, and how much damage it could involve.
Earthquakes
Earthquakes have been a part of Long Valley history for over 4 million years. However, a swarm of earthquakes in May of 1980, measuring around a magnitude of 6, informed USGS that they may need to take a closer look at the caldera [USGS- F.S. 108-96, 2000]. Since then, small scale earthquakes have continued to occur weekly in the area. A network of seismometers currently occupies the Long Valley caldera and informs USGS of any seismic activity. Typically, earthquakes of the area, especially swarms, are directly related to deformation patterns.
Figure 3 This image shows the earthquake activity of Long Valley caldera between 1978 (year before first noticeable swarm of earthquakes) and 1995. Since 1980, the ground of the caldera has uplifted about 2.5 feet and continues to increase. Figure reproduced from [USGS F.S. 108-96, 2000]
Deformation
Before 1979, the caldera appeared to be stable, showing little to no uplift. However, after the earthquake swarms of 1980, those monitoring the caldera noticed a gradual uplift near the center of the caldera. By year 2000, the total uplift of the dome-like structure totaled 2.5 feet and covered an area of 100 square miles [USGS F.S. 108-96, 2000]. The deformation can most likely be attributed to rising magma within the volcanic structure.
Monitoring ground deformation usually involves techniques and instruments such as Electronic Distance Measurements with benchmarks, measuring the tilt of the volcano with Tiltmeters, monitoring the uplift with Global Positioning Systems, and forming computerized models of deformation with Satellite Radar Inferometry. These technologically advanced systems are key components to predicting the behavior of volcanoes.
Hydrologic
Hydrologic studies within Long Valley include monitoring springs, streams, wells, fumaroles, and precipitation. By comparing current observations of these areas with historic data, scientists can determine how volcanic activity might be affecting water systems [USGS- Hydrologic, 2003].
Earthquakes and ground uplift often give rise to fractures in surrounding rock areas. Once the rock is broken, magma is allowed to rise, heating up groundwater, and occasionally causing geysering [USGS- Boiling, 2007]. Because earthquakes and ground deformation are continual occurrences in the Long Valley area, the formation of hot springs is quite common. Changes in the temperatures of these springs help scientists to determine how much volcanic activity is taking place.
Gas Emission
Mammoth Mountain , where several tree kill areas have been identified, is a point of interest for scientists monitoring volcanic gas emissions. Carbon dioxide is a component of magma and most likely seeps through the ground as the rock overlying the magma chamber fractures [USGS- F.S.172-96, 2000]. To monitor the volcanic activity in the area of Mammoth Mountain , scientists of USGS' Volcano Hazards Program have set up carbon dioxide detectors around the tree kill areas. Most of these infrared detectors are portable and require the scientists to take measurements by hand.
Carbon dioxide and sulfur dioxide are the most commonly measured volcanic gases. However, they can be difficult to measure because they either disperse quickly, or dissolve in surround water [USGS- Monitoring Gases, 2000]. Sometimes it is necessary to take soil-efflux measurements or collect gas samples directly from fumaroles.
Figure 4 A scientist takes measurements of gas emission directly from a fumarole. This procedure provides information for careful chemical analysis of the volcanic activity, however there are great risks involved because the collector of the data must be in close contact with the restless volcanic vent. Figure reproduced from [USGS- Direct Sample, 2000] (exact reproduction).
Mitigation
Typically, the events occurring before, during, and after a volcanic eruption have great impacts on the environment as well as the lives of people, plants, and animals. Each year, a great deal of effort is put into finding ways to mitigate these volcanic hazards.
Monitoring
By monitoring the activity around volcanic sites, scientists become equipped with information that could lead to predictions. The predictions can also be reinforced by noting patterns generated by previous volcanic activity. For example, one could track the thickness and ground deformation of the volcanic area over time or look at how long it has been since the last eruption took place.
Land-use Planning
Land-use planning is also a key practice for mitigating volcanic hazards. For example, since volcanic eruptions can have a great impact on rivers and surround water, it makes sense to avoid building in those areas. To aid in this process, most areas around active volcanoes implement Volcanic Hazard Zones which are unique to each volcano [USGS- Developing Plan, 2001]. These zones indicate what areas could be affected by lahars, pyroclastic flows, lava flows, etc.
Figure 5 Example zonation map of Mount Hood, Oregon. Figure reproduced from [ USGS F.S.060-00, 2000] (exact reproduction)
Response Plan Alerts
Another important aspect of hazard mitigation is public awareness/education. In order to alert people of the volcanic activity in an area, the United States Geological Survey has issued several response plans to be enforced according to the levels of volcanic activity at any given time. The following response plan is an abbreviated version of the protocols followed by those in the vicinity of Long Valley Caldera.
Level 1: Green- No Immediate Risk
The Long Valley Caldera is currently in this condition. The geologic behavior could involve daily earthquakes of magnitude 2-4 and/or carbon dioxide emissions from Mammoth Mountain of 500 tons or less per day.
Under these conditions the USGS operates as usual and, depending on the current geological behavior, communication between scientists and local authorities could occur.
Level 2: Yellow- Intense Unrest
This condition could include swarms of earthquakes over a magnitude of 5 along with carbon dioxide emissions of 1000 tons per day and/or sulfur dioxide emissions of 100 tons per day. There also could be strain or displacement of field instruments over a 48 hour period.
During this time, two Long Valley Observatory field offices would be established and a “Watch” message would be sent to the Office of Emergency Services to contact local authorities
Level 3: Orange- Warning; Eruption likely within hours to days
At this time, strain and displacement of field instruments over a 24 hour period would have occurred. Also, sustained, shallow earthquakes would be underway along with carbon dioxide and sulfur dioxide emissions surpassing the Yellow condition tenfold.
Under this condition, USGS would issue a Geologic Hazard Warning while intensely monitoring on-site volcanic activity. The governors of California and Nevada would be contacted and the public would be informed of the hazard.
Level 4: Red- Eruption in progress
This level has four sub levels, depending on how violently the volcano is erupting.
At this time, USGS would be continually monitoring the volcanic activity and updating the civil authorities hourly to daily [USGS Response Plan, 2001].
Conclusions
Volcanoes present many hazards that have the potential to harm people and all living things, damage property, and destroy land. The hazards directly presented by volcanoes can create subsequent disasters such as lahars, acid rain, and floods. However, through careful monitoring, the effects of volcanic and related hazards can be mitigated through planning and awareness/education of the public.
Works Cited
Agency for Toxic Substances and Disease Registry. (1998). Public Health Statement for Sulfur Dioxide. Retrieved May 24, 2008 from, http://www.atsdr.cdc.gov/toxprofiles/phs116.html
Environmental Protection Agency. (1997). National Air Quality and Emissions Trends Report: 1997: Chapter 7: Acid Deposition . Retrieved May 30, 2008 from, http://www.epa.gov/air/airtrends/aqtrnd97/chapter7.pdf
Hathaway, G.L., Proctor, N.H., Hughes, J.P., and Fischman, M.L. (1991). Proctor and Hughes' chemical hazards of the workplace: Van Nostraud Reinhold, New York, 3rd ed.
Hill , Mary .( 2006). Geology of the Sierra Nevada (Rev. ed.). Berkeley and Los Angeles , CA : University of California Press.
Scott, W.E., 1989, “Volcanic and Related Hazards,” Ch. 2, in Volcanic Hazards, Tilling, R.I., ed., Short Course in Geology, v. 1, p. 9-23
U.S. Geological Survey. (1999). Lake breakout causes lahars at Mt. Pinatubo , Philippines . Retrieved May 29, 2008 from, http://volcanoes.usgs.gov/Hazards/What/Lahars/LakeLahar.html
U.S. Geological Survey. (1999). Photos of Bishop Tuff Volcanic Deposits. Retrieved May 30, 2008 from, http://lvo.wr.usgs.gov/gallery/BishopTuff_1.html
U.S. Geological Survey. (1999). Volcano Hazards: Tephra, including Volcanic Ash. Retrieved May 24, 2008 from, http://volcanoes.usgs.gov/Hazards/What/Tephra/tephra.html
U.S Geological Survey. (2000). Direct Gas Sampling and laboratory analysis. Retrieved May 31, 2008 from, http://volcanoes.usgs.gov/About/What/Monitor/Gas/sample.html
U.S Geological Survey. (2000). Fact Sheet060-00: Mt. Hood- History and Hazards of Oregon 's Most Recently Active Volcano. Retrieved May 30, 2008 from, http://pubs.usgs.gov/fs/2000/fs060-00/
U.S. Geological Survey. (2000). Fact Sheet 108-96: Living With a Restless Caldera- Long Valley , California . Retrieved May 24, 2008 from, http://pubs.usgs.gov/fs/fs108-96/
U.S. Geological Survey. (2000). Fact Sheet 169-97: Volcanic Air Pollution- A Hazard in Hawai'i . Retrieved May 24, 2008 from, http://pubs.usgs.gov/fs/fs169-97/
U.S. Geological Survey. (2000). Fact Sheet 172-96: Invisible CO2 Gas Killing Trees at Mammoth Mountain , CA. Retrieved May 24, 2008 from, http://pubs.usgs.gov/fs/fs172-96/
U.S. Geological Survey. (2000). Volcano Hazards: Lava Flows. Retrieved May 30, 2008 from, http://volcanoes.usgs.gov/Hazards/What/Lava/lavaflow.html
U.S. Geological Survey. (2000). Volcano Monitoring Techniques: the driving force of eruptions. Retrieved May 31, 2008 from, http://volcanoes.usgs.gov/About/What/Monitor/Gas/GasMonitor.html
U.S. Geological Survey. (2001). Developing a Volcano Emergency Plan. Retrieved May 31, 2008 from, http://volcanoes.usgs.gov/About/What/Reduce/DevelopPlans.html
U.S. Geological Survey. (2001). Response Plan for Volcano Hazards in the Long Valley Caldera and Mono Craters Region California . Retrieved May 29, 2008 from, http://pubs.usgs.gov/bul/b2185/home.html
U.S. Geological Survey. (2003). Hydrologic studies in Long Valley caldera, CA. Retrieved May 30, 2008 from http://lvo.wr.usgs.gov/HydroStudies.html
U.S. Geological Survey. (2007). Fact Sheet 2007-3045: Boiling Water at Hot Creek- The Dangerous and Dynamic Thermal Springs in CA Long Valley Caldera.. Retrieved May 30, 2008 from, http://pubs.usgs.gov/fs/2007/3045/