Geology and Natural Heritage of the Long Valley Caldera
Volcanic Hazards of the Long Valley Caldera
Nathaniel Brewer
Abstract
The Long Valley Caldera has been the site of a myriad of volcanic events in the past, and very well could be in the future. The primary hazards associated with volcanism in the Long Valley Caldera are pyroclastic flows, lava flows and domes, and tephra ejected from the volcano. Instances of these hazards in the caldera have been recorded in the past, and occurrences in the future could have far reaching effects, as well as having large effects in the caldera itself. To predict and plan for such eruptions, volcanoes must be monitored. Monitoring methods include measurements of seismic activity, ground deformation, and volcanic gas emissions. These methods allow us to understand the inner workings of the volcanic system, and predict future activity. The USGS has used data retrieved from the past to form a plan in case an eruption is detected. Ultimately, a future eruption is likely, though likely not in the immediate future, and probably of relatively modest size and intensity.
Introduction
Located in Eastern California, about 20 miles south of Mono Lake , is a large bowl-shaped depression in the earth, known as the Long Valley Caldera. It was formed by the collapse of a magma chamber from a massive eruption 760,000 years ago, and remains a hotbed of volcanic activity today. Another eruption, even of much, much smaller magnitude, could affect areas as far away as Reno , Nevada and Sacramento , California , as well as doing untold damage to the busy resort town of Mammoth Lakes, located within the caldera, and the many small towns located in the region. A large eruption could affect a large portion of the United States , with ejected ash stretching enormous differences. The eruption that formed the caldera covered 2,200 square kilometers with hot volcanic material. [http://lvo.wr.usgs.gov/gallery/BishopTuff_1.html] In light of this danger, it is important to understand what exact hazards are posed by the Long Valley Caldera, how they are being monitored, and what will be done in the case of volcanic activity.
HAZARDS
Pyroclastic Flows and Surges
Pyroclastic Flows and Surges are the most dangerous hazard presented by volcanism. Pyroclastic Flows are what one imagines when thinking of an erupting volcano, a large, hot, powerful cloud racing down the volcano at high speed, destroying everything in its path.
Pyroclastic Flows-
Pyroclastic Flows and Surges are differentiated by their density and the ratio of solid to gas matter they contain. Pyroclastic Flows are dense and contain a high amount of solids. [Scott, 1989]
Flows appear as a fast moving billowy cloud expanding downhill from the volcanic vent. Flows are a mixture of extremely hot (as high as 800 degrees C) gasses and volcanic rock. [Scott, 1989] Flows have two components, a layer of heavy, dense rock that rides over the ground and a mixture of gas and volcanic ash that soars above it. All flows share this in common, though the action and nature of individual flows can differentiate wildly depending on factors including topography of the volcano and surrounding areas, and the composition of the pyroclastic material. Pyroclastic flows, by their nature are �ground hugging� and highly controlled by the lay of the land, they travel down hill, and seek low lying areas and valleys. [http://volcanoes.usgs.gov/Hazards/What/PF/pcflows.html]
The size of pyroclastic flow is controlled by the size of the eruption as well as the composition of the flow. Heavy, dense flows comprised primarily of heavy rock don't flow very far, usually only a few kilometers to tens of kilometers from the eruption. Huge flows made up of more ash and pumice can flow much farther, as far as 200km from the eruption, and are less constrained by topography. [Scott, 1989].
Creation of Pyroclastic Flow
Pyroclastic flows can be created in several ways. Eruptions can cause flows by erupting bursts of gas and magma that erupt like a fountain from the eruption vent, [Scott, 1989] or by the collapse of a giant �vertical eruption column.� [http://volcanoes.usgs.gov/Hazards/What/PF/PFFormation.html]
In the event of a collapsing vertical eruption column, the cylinder of material that extends vertically into the air during an eruption is overcome by gravity and collapses, sending material rushing down the volcano. [Scott, 1989] Pyroclastic flow can also be created by the collapse of lava flows or lava domes. Thick, viscous lava can emerge from a volcanic vent and cool, forming a lava feature such as a dome or flow. Then, structural instability can cause such a feature to collapse, sending hot rock and gas down hill in a pyroclastic flow. [http://volcanoes.usgs.gov/Hazards/What/PF/PFUnzen.html]
Pyroclastic Surges
Pyroclastic surges are in many ways simply a less dense, diluted pyroclastic flow, but there are some differences depending on whether the surge is �hot� or �cold.� Hot surges really are little different than diluted flows, they are often caused by similar phenomena as flows, and can precede or even create flows. They are more maneuverable than flows, however. �Cold� flows, on the other hand, are formed when magma contacts some form of water. These surges aren't very large, usually traveling 10 km or less, but can still be very dangerous, and often contain large explosions. [Scott, 1989]
Pyroclastic Flows and Surges in the Long Valley Caldera
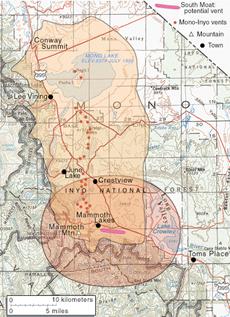
Fig.1. Map from C.D. Miller, modified by J. Johnson.
Source: USGS Long Valley WebsiteFig. 1 depicts the predicted hazard zones in the event of pyroclastic flow in the long valley caldera as well as along the Inyo-Mono chain of volcanic domes. One can see the tendency of pyroclastic flow to move down hill and fill low lying areas in the way that flow is expected to fill the caldera like a bowl. It is predicted that an eruption from vents along Mammoth Mountain could travel even farther than this due to the extra velocity the flow would pick up from racing down the sides of Mammoth. [http://lvo.wr.usgs.gov/zones/index.html#pyro]
Effects of Pyroclastic Flows and Surges
The intense mixture of heat, speed, and mass coupled with the possibly toxic nature of some of its components make pyroclastic flows incredibly powerful and dangerous, literally destroying everything in their path. Most objects or structures caught in the path of an advancing flow are destroyed by impact. Anything left is either burned by the heat or simply buried underneath meters of volcanic material. Flows can even effect areas outside of their immediate impact, by causing fires with their heat or by melting ice and snow to create large amounts of melt water and in turn lahars and floods. [http://volcanoes.usgs.gov/Hazards/What/PF/pcflows.html]
Tephra
Tephra is pieces of rock and lava ejected from a volcano during an eruption. Though less immediately destructive and dangerous than pyroclastic flows, tephra poses the most widespread danger associated with volcanism. Particles ejected can be anywhere from a few millimeters to several meters in diameter. Tephra is assigned a variety of names depending upon its size. Very small (less than 2 mm) particles are called ash, moderate (2-64 mm) pieces are called lapilli, and large (greater than 64 mm) chunks are known as bombs. [http://volcanoes.usgs.gov/Hazards/What/Tephra/tephraterms.html]
Creation
When a volcano erupts explosively, a large mass of hot rock and gas is expelled into the air, what is known as an eruption column, a tall cylinder reaching high into the air. The column then spreads out to form an eruption cloud. http://vulcan.wr.usgs.gov/Hazards/Publications/OFR95-231/OFR95-231.html]
Larger lapilli and bombs are ejected out and fall to the ground relatively near to the volcano. Ash, however, is small and light enough that it can be picked up by the wind, and can travel hundreds of kilometers, with far reaching effects. [Scott, 1989]
Effects
The main immediate danger presented by tephra is that of large chunks of rock damaging people or property. Fortunately, the size of tephra lessens further from the volcano, leaving little more than ash and small lapilli past a distance of 5 km or so for most eruptions. [Scott, 1989]
Ash, then, provides most of the danger from tephra, and is also the volcanic hazard most people would face in the event of a volcanic eruption. Though small in particle size, ash is extremely destructive, generally through damage to property and secondary effects, though it can be dangerous if ingested. Ash is not in fact �ash� but rather very small fragments of rock. Because of this, it is extremely abrasive. Ash can damage electrical equipment, and often necessitates the shutting down of power-plants during an eruption. Areas that receive a large amount of ash will experience periods of darkness or lessened sunlight, as ash can block out the sun. Ash can do large damage to agriculture; it covers crops and can kill it depending on the amount and the age of the plants. Ash contains chemicals that can be damaging to animals if ingested, as well. Ash is very dense, and often collapses roofs if it collects on them. Ash weighs about 880-1545 lb/yd^3, but increases in weight dramatically when wet, as much as doubling in weight. Ash proposes a huge threat to flying aircraft. It can abrade and damage the outside of the plane, and is sucked through the intakes, where it can damage the engine and electronics. [http://volcanoes.usgs.gov/Hazards/What/Tephra/tephra.html]
Tephra in Long Valley Caldera
Tephra is difficult to predict due to the strong control wind currents have over its dispersal. We cannot say now how the wind will be blowing during the time of an eruption, though by looking at average wind speed and direction we could make a broad guess. The size of the eruption also has an immense effect on the amount of tephra erupted, making it hard to guess how far reaching the tephra would be without more knowledge about the eruption.
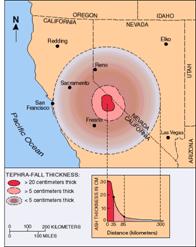
Potential hazards from tephra fall for small to moderate-sized eruptions in the
Long Valley -- Mono Lake Area, California
Map from C.D. Miller, modified by J. Johnson .
Source: USGS Long Valley WebsiteThis is the predicted thickness of tephra from a small eruption in the Long Valley Caldera and surrounding area. Future eruptions are likely to be small or moderate in size, making this an appropriate estimate of what could occur. Even a small eruption could be enough to cover Reno and Sacramento in 5 cm of ash. For larger eruptions, the area of effect could be drastically increased. The eruption that formed the Long Valley Caldera erupted 600 km^3 of magma, or 600 times more than is represented on this map. [http://lvo.wr.usgs.gov/History.html]
Lava Flows and Domes
The Long Valley Caldera, and surrounding area, has been the site of many effusive eruptions that have created lava flows and domes in the past, and could very well be experience more in the future.
Lava Flows
Lava flows and domes are created by the effusion of lava from a volcanic vent. The difference between the two is caused by the composition of the magma that constructs them. Lava flows are created by less viscous magma, often basaltic, that flows relatively slowly down hill from the vent, following the topography of the area. Fluid, basaltic flows have been known to cover massive areas of land if their effusion rate is sufficiently high. [Scott, 1989]
Lava Domes
Lava domes are formed by the effusion of more viscous lava, usually dacitic or rhyolitic. This viscous lava doesn't travel very far, often sort of bubbling out on top of itself, forming lava domes, steep mounds of lava that resemble a bubble of rock sitting on the ground. [http://lvo.wr.usgs.gov/zones/index.html#lavaflow]
Effects
The danger presented by lava flows is their intense heat. Like pyroclastic flows, lava flows destroy most everything they come in contact with. Unlike pyroclastic flows, however, they move extremely slowly, and because of this pose little threat top humans, in most cases. However, they can still do a lot of damage to property.
Lava domes move even slower, and for less distance, but actually can pose the greatest threat, as the collapse of one can create a pyroclastic flow (see Creation of Pyroclastic Flow). [http://lvo.wr.usgs.gov/zones/index.html#lavaflow]
Lava Flows and Domes in the Long Valley Caldera
The Long Valley Caldera and the area to its north have been the location of several lava flows and domes, known as the Inyo-Mono Crater chain. The next eruption is believed to take place along this line, most likely outside of the caldera. [http://lvo.wr.usgs.gov/Outlook.html]
Mammoth Mountain was built by a series of lava domes, and another one is possible. Such an occurrence would be very dangerous if a dome were to collapse and form a pyroclastic flow. [http://lvo.wr.usgs.gov/zones/index.html#pyro]
Monitoring
Seismic Monitoring
The Measurement of seismic activity at and near volcanoes is extremely important, as virtually all volcanic eruptions exhibit a swarm of earthquakes and seismic activity prior to eruption. [McNutt, 1996]
Generally, seismic activity near volcanoes is measured by a network of seismometers spaced as near to each other as possible, as well as a few placed several tens to hundreds of kilometers away. The close spacing of seismometers helps to increase the accuracy of detection, especially of small earthquakes. Having measurements from a large distance away is important to help differentiate whether seismic activity is caused by volcanic activity, or the effect of a distant regional earthquake. [McNutt, 1996]
One of the key difficulties in monitoring volcanic is the amount of �background� seismicity, activity that is common to the area and does not indicate a coming eruption. To weed out these interfering factors, several years of measurements should be obtained to create a �baseline� of normal seismic activity. [McNutt, 1996]
Prediction
The ultimate goal of seismic monitoring is to predict future eruptions. Researchers generally look for swarms of eruptions following a period of quiescence, usually a good indicator of an eruption. In areas of high seismic activity like Long Valley Caldera, this is very difficult, as there are almost constant earthquakes that do not herald an eruption.
Seismic monitoring can also help determine the location of an eruption. Earthquakes often originate under the place that will erupt in the future. Similarly, seismic monitoring is used to determine the size and location of magma chambers, as earthquakes move more slowly through the less rigid rock. [McNutt, 1996]
One important occurrence seismic monitors look for is harmonic tremor, a distinct activity volcanoes cause. Harmonic tremor precedes a vast majority of eruptions, but usually only by a short period of time. [McNutt, 1996]
In Long Valley Caldera
Within Long Valley Caldera are 18 seismometers, with another 20 within a 50 km radius. They record the extremely frequent earthquakes that occur in the area. In the last week alone 18 earthquakes have occurred in Long Valley Caldera.
Beginning in 1980, a dramatic upswing in earthquake activity increased interest in monitoring Long Valley Caldera. Since then, there have been several periods of alternating rest and strong earthquake activity. These are especially important, as periods of activity can increase the possibility of eruptions. [Hill, et al. 2002]
Ground Deformation
The Measurement of ground deformation is important in volcano monitoring and eruption prediction. Ground deformation is caused by the movement of material underneath the earth's surface. Magma or gas can move and become trapped, forming bulges on the surface, or could sink and lower the ground level, as well as move horizontally. Measurements in ground deformation help to present a picture of the subterranean inner workings of a volcano, with special emphasis on keeping track of the movement of magma. Often volcanic activity is preceded by ground deformation of some kind. However, a certain amount of deformation is �normal� even during quiet periods, meaning, like with seismic monitoring, an extensive period of measurement needs to be conducted to determine a volcano's baseline deformative tendencies. [Van der Laat, 1996]
Techniques
Direct leveling: The most accurate and precise method for measuring vertical displacement is direct, or geometric, leveling. It is performed by a small team of surveyors with stadia rods and a level gun to measure the displacement between two points. Although, when carried out with the utmost care, it is the most precise measurement method, it has many downsides. It can be difficult to find appropriate locations, it requires suitable ground and the ability to see the two points from one another. It relies heavily on humans taking measurements, and there for is open to human error. Most of all, though, it requires several people working in the field for a possibly long time period. This can be costly and difficult, meaning that at best direct leveling can be only carried out periodically, versus more recent developments that allow continuous measurement. [Van der Laat, 1996]
Tiltmeters
Tiltmeters are devices that measure change in slope of the earth's surface. They contain a small liquid bubble inside of a chamber, with the bubble shifting when the chamber is tilted. Often, they now also contain an electronic device that reads the bubble and allows continuous monitoring. They are usually positioned on the side of a volcano, to measure change in its slope. Their main weakness is that temperature change can affect the liquid within the chamber, hurting the data. [Van der Laat, 1996]
GPS
The use of the Global Positioning System for measurement of ground deformation is a relatively recent development, but a very dynamic one. GPS measurement uses an array of satellites to measure the location of any spot on earth. It has many benefits including the ability to measure both vertical and horizontal movement, as well as the capacity for continuous measurement. It also has the ability to record the movement of one point in relation to one hundreds or thousands of miles away. This fixes the problem posed by direct leveling, how to measure two points out of eyesight of one another. GPS is not incredibly accurate, however, though it has improved slightly. [Van der Laat, 1996]
Two-Color EDM Geodimeter
The two-color EDM Geodimeter is an instrument primarily used to measure horizontal deformation. It uses a laser, reflected off of reference points placed on areas of deformation. It has been used for several decades to measure displacement in the caldera, and has been used to estimate vertical displacement when other measurements were unavailable. [http://pubs.usgs.gov/dds/dds81/Intro/MonitoringData/Geodetic/EDM/EDM.html]
Ground Deformation Measurements in Long Valley Caldera
Currently, the USGS is monitoring ground deformation in the caldera using an array of tiltmeters, continuous GPS data, and measurements made with a two-color EDM geodimeter.
There are a large number of tiltmeters placed around the caldera, unfortunately, however, their data is not available from the USGS website at the time of this writing, due to instrument failure.
The USGS has been making two-color EDM geodimeter measurements approximately three times a week since 1983. [http://pubs.usgs.gov/dds/dds81/Intro/MonitoringData/Geodetic/EDM/EDM.html]
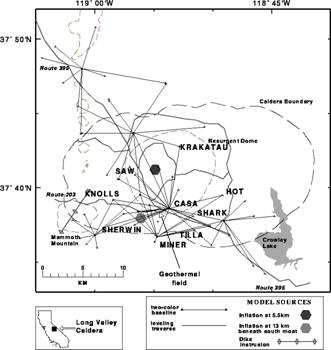
Source: USGS Long Valley 2-Color EDM website:
http://pubs.usgs.gov/dds/dds-81/Intro/MonitoringData/Geodetic/EDM/EDM.htmlThis figure shows the lines of measurement recorded by the two-color EDM in the caldera. Also of note are the two points of inflation that have been measured. These are believed to be inflations of magma reservoirs, and are likely a few of the causes of the increased earthquake activity in the caldera since 1980. [Hill, et al. 2002]
There are 20 GPS devices placed within and surrounding Long Valley Caldera, measuring movement in all directions. Data shows a cycle of back and forth movement for most of the locations, with occasional exceptions.
CO2 Monitoring
At low depth and high pressure, gases become dissolved in magma. If that magma then rises towards the surface, its pressure decreases, allowing the gas trapped within to expand and escape, known as degassing. Because such an occurrence involves magma rising towards the surface it can be a cause of volcanic activity, and often is an indicator of magmatic intrusion. [http://volcanoes.usgs.gov/Hazards/What/VolGas/volgas.html]
At Mammoth Mountain
Mammoth Mountain became the site of volcanic CO2 emissions during the late 1980s. It is thought that the 1989 earthquake swarm at Mammoth broke through rock that was �sealing� a large gas chamber within Mammoth. This seems likely, as the CO2 gas vents are largely aligned along known fault lines. [Hill, 2005] The CO2 was originally detected in 1990, when large areas of trees began to die in various locations around Mammoth. It took until 1994 for the cause to be determined as volcanic CO2 emissions. The percentage of CO2 gas in normal soil is about 1% generally, but the tree kill areas see percentages anywhere from 20-95%.[http://pubs.usgs.gov/fs/fs172-96/]
Monitoring
The USGS has built four continuous measurement sites, as well as carrying out periodic measurements carried out on 50-100 scattered emission sites around Mammoth. The measurements are performed with flow meters, measuring the rate of emission of the CO2 gas. The average emission rate in Mammoth is 110 +/- 24 metric tons per day. [http://lvo.wr.usgs.gov/CO2.html] This amount has been fairly consistent since the mid 1990's. Most fluctuations have been attributed to various atmospheric changes, rather than any change within the magma chamber, nothing to indicate increasing volcanic activity. There was, however, an earthquake swarm in 1997 that triggered a temporary increase in CO2 output. [Hill, 2005]
Response
The USGS has prepared a response plan for the event of an eruption in Long Valley Caldera. The plan involves a four level coding system, green, yellow, orange, and red, based on very carefully stated levels of volcanic activity, and corresponding to increasing levels of danger. The systems in place for monitoring in the caldera are the primary detection devices for volcanic activity. There are specific thresholds in place for seismic activity, ground deformation, and gas emissions that will trigger changes to the various levels of volcanic activity. For example, here is the chart used to determine volcanic danger based on ground deformation:
Table C1. Criteria for deformation and strain rates for color-code conditions under table 2.
Condition Code
Strain and/or tilt rates 1
Displacement rates 2
24-hr (ppm/d)
weekly (ppm/w)
annual (ppm/y)
24-hr (mm/d)
weekly (mm/w)
annual (mm/y)
GREEN
Quiescence & Weak unrest<0.01
<0.1
<5
NA**
NA
<5
Minor Unrest
>0.01
>0.1
>5
NA
NA
>5
Moderate-to-strong unrest
>0.1
>1
>50
NA
>5
>20
YELLOW
>1
>10
>500
>5
>50
>2,000
ORANGE
>10
>100
>5,000
>50
>500
>20,000
1 Strain and tilt rates based on corresponding displacement rates over a 5-km baseline.
2 Displacements below 1 mm and not resolvable by the 2-color EDM and GPS systems.Source: USGS Response Plan
The USGS has implemented specific rates of strain, tilt, and displacement that will initiate the prescribed levels of response. The increased levels of response also warrant the formation of a field monitoring station in Mammoth Lakes, or further away if it becomes too dangerous, to perform more intense and continuous monitoring of the active volcanic systems. [Hill, et al., 2002]
At early warning levels, the USGS will place discrete calls to scientists monitoring the caldera, as well as local authorities. As volcanic activity increases, the field offices are set up, and eventually a Volcanic Hazard Warning may be released to the general public. [Hill, et al., 2002]
Conclusion
It is virtually certain that the Long Valley Caldera will be the site of volcanism in the future. It is a young volcanic reason, it has been the site of numerous volcanic eruptions in the past, and the Inyo-Mono chain, stretching from within the caldera to the north has experienced several eruptions as recent as 250 years ago. The caldera has also been the site of much seismic activity during the last two decades, and is still experiencing daily earthquakes. This said, it is unlikely that any volcanism will be anywhere near the level that formed the caldera 760,000 years ago. Most likely, the next eruption will be along the Inyo-Mono Chain, to the north of Mono Lake . It may be either explosive or effusive, but will most likely be only modest in size, though it could still do a decent amount of damage through ash fall to at least Mammoth Lakes and the surrounding towns, and could spread quite far throughout the West if there is sufficient ash and strong winds. The USGS is currently doing a good job monitoring the caldera, especially as there are no indications of an imminent eruption presently. This said, there is still nothing specifically preventing there from being another massive eruption in the caldera. We'll just have to wait and see.
Works Cited
Hill, David P., 2005, Magmatic Unrest Beneath Mammoth Mountain , California , Journal of Volcanology and Geothermal Research , v. 146, pp. 171-172
Hill, et al., 2002, Response Plan for Volcano Hazards in the Long Valley Caldera and Mono Craters Region, California, USGS publication, p.31, pp
McNutt, S.R., 1996, Seismic Monitoring and Eruption Forecasting of Volcanoes: A review of the State-of-the-Art and Case Histories, in Monitoring and Mitigation of Volcanic Hazards, R. Scarpa and R.I. Tilling, eds., Springer, pp. 99-146
Scott, William E., 1989, Volcanic and Related Hazards, American Geophysical Union
U.S. Geological Survey, Long Valley Website, Various:
http://lvo.wr.usgs.gov/gallery/BishopTuff_1.html , http://lvo.wr.usgs.gov/zones/index.html#pyro ,
http://lvo.wr.usgs.gov/History.html ,
http://lvo.wr.usgs.gov/zones/index.html#lavaflow ,
http://lvo.wr.usgs.gov/Outlook.html ,
http://lvo.wr.usgs.gov/CO2.htmlU.S. Geological Survey Website, Various: http://volcanoes.usgs.gov/Hazards/What/PF/pcflows.html , http://volcanoes.usgs.gov/Hazards/What/PF/PFFormation.html , http://volcanoes.usgs.gov/Hazards/What/PF/PFUnzen.html , http://volcanoes.usgs.gov/Hazards/What/Tephra/tephraterms.html , http://vulcan.wr.usgs.gov/Hazards/Publications/OFR95-231/OFR95-231.html , http://pubs.usgs.gov/dds/dds81/Intro/MonitoringData/Geodetic/EDM/EDM.html , http://volcanoes.usgs.gov/Hazards/What/VolGas/volgas.html , http://pubs.usgs.gov/fs/fs172-96/ ,
Van der Laat, R., 1996, Ground Deformation Methods and Results, in Monitoring and Mitigation of Volcanic Hazards , R. Scarpa and R.I. Tilling, eds., Springer, pp. 147-168