Geology and Natural Heritage of the Long Valley Caldera
Volcano Monitoring Techniques and their Implications for the Forecasting and Prediction of Current and Future Volcanism in the Long Valley Caldera; South Eastern California
William Simmons
The Long Valley Caldera (LVC) is an area created and defined by its rich volcanic history. The area's volcanism is restless still today, taking shape in the form of seismic activity (earthquake swarms), ground deformation (resurgent dome), and volcanic gas emissions ( Mammoth Mountain tree kill). Activity such as this presents direct hazards to the people living in and around the caldera as well as provides clues to future volcanic events. By monitoring the volcanic restlessness of the LVC scientists are able to asses the hazards it creates and better forecast and predict future volcanic events.
The LVC, itself, is a gigantic 20 by 10 mile collapse structure that formed 760,000 years ago when the roof above a giant magma chamber caved in. The exposure of the chamber, 4 miles beneath the surface, released its gaseous rhyolitic load from tremendous pressure expelling 150 cubic miles of magma before the vent sealed itself. The eruption landed ash fall deposits as far away as Nebraska and sank the area more than a mile into the space once occupied by the magma chamber, forming the caldera [Hill et al., 2000].
Volcanism has persisted in the area since then and has produced most of the landforms we see today. The Mono-Inyo volcanic chain, the product of a north moving dike, has produced several volcanic features. It extends from Mammoth Mountain , in the southwest rim of the caldera, north and out of the caldera into the Mono Basin . Activity and eruptions along this chain began 400,000 years ago creating Mammoth Mountain (220-50,000 years ago) [Hill et al. 2000]. More recent activity (600 years ago) created Deadman, Obsidian, and Glass Creek domes after a series of explosive eruptions as well as phreatic craters near Deer Mountain . The youngest volcanic eruption in the chain of 21 volcanoes, though, occurred only 640 years ago at Panum Crater , continuing the dikes northward extension.
The most recent chapter of unrest in the LVC began in 1978 with the beginning of a period of earthquake swarms that took place in the southern part of the caldera. Following a severe swarm that included 4 magnitude 6 earthquakes in 1980, an uplift, caused by the intrusion of magma at a shallow depth, was noticed in the middle of the caldera [Hill et al., 2000]. Uplift at this resurgent dome has caused the area to rise almost a meter since 1979 and is monitored by a combination of seismic and uplift monitoring techniques.
Monitoring of current events such as the rising of the resurgent dome and the understanding of an area's eruptive history provides important information for the forecasting of future volcanic events. Hill et al. [2000] states that based on the volcanic activity over the past 5000 years in the LVC, the next eruption in Long Valley will probably be along the Mono-Inyo chain. This is a forecast based on the area's eruptive history and thus is long-term (years, decades, etc.). Whereas monitoring of seismicity, ground-deformation, gas emission, and other forms of volcano monitoring provide real-time data. This allows short-term forecasts of volcanic activity (weeks, days, hours, etc.) that can be helpful in alerting and reducing hazard to government officials and denizens of a volcanic area in times of eruption [Tilling, 1989].
Long Valley Caldera is one of the most studied volcanic areas in the world [Francis and Oppenheimer, 2004] and accordingly is studied by a combination of the world's most advanced volcano monitoring techniques. According to Banks et al. [1989], it is techniques that observe seismic activity and ground deformation that provide the most unambiguous data regarding the migration of volcanic fluids (magma and hydrothermal water). Francis and Oppenheimer [2004], though, posit that gas emission and other geochemical data is also relevant in the assessment of volcanic activity.
Seismic activity in a volcanic region can be caused by the movement of magma. As a body of magma intrudes into a new area it fractures and separates country rock or vibrates fluid filled cracks creating seismic waves (volcanic earthquakes) [http://volcanoes.usgs.gov/About/What/Monitor/Seis/SeisMonitor.html, 2000]. Different types of volcanic earthquakes occur at different stages in the migration of volcanic fluids. Each type has a signature seismic pattern that can be identified (Minakami scheme) and can aid in the short-term forecasting of future volcanic events. Such precise data, however, can only be obtained instrumentally as many earthquakes are too weak to be observed by human sense [Tilling et al., 1989].
For seismic data to be the most useful it should reflect the type, location (latitude, longitude, and depth) of hypocenter, magnitude, and time of occurrence of each volcanic earthquake in a volcanic area [Banks et al., 1989]. Changes in the type of volcanic earthquakes provide understanding of the volcanic fluids that generate them. Depth, source type (magma, geothermal fluids, eruption, etc.), transport medium of seismic waves, and stage of eruption are all types of information that can be inferred from knowing the type of volcanic earthquake. Location of each earthquake hypocenter can be plotted in map and cross-section views to show lateral and vertical migration of seismicity (migration of magma). Generally, the more seismic energy released in a volcanic area the greater the chance of eruption [Banks et al., 1989]. Energy released is expressed by magnitude. According to the USGS Monitoring Volcano Seismicity website [2000] earthquake activity beneath a volcano increases before eruption. Time of each earthquake occurrence determines how frequently earthquakes are occurring.
Seismicity data such as this is recorded by seismometers in the field that then send information back to a central recording site, translated as seismograms, and analyzed and interpreted by a scientist or computer program. To accurately locate all earthquakes in an area of volcanic activity a network of seismometers connected by telemetry to a central recording site is required. The network should include seismometers on or near the volcanic vent, most surrounding the volcanic vent, and some located outside the volcanic area [Banks et al. 1989 and Francis and Oppenheimer, 2004]
Seismometers in the network are placed at the bottoms of bore holes or collapsed lava tubes in order to reduce wind and vehicular noise. They are arranged in geometric arrays surrounding the volcanic area with some as close to the vent as possible so as to record even the smallest of seismic events. The network, acting as a net for seismic waves in a volcanic area, should also include outgroup seismometers (20 Km away) to discern between regional seismic events and events occurring within the volcanic area [Francis and Oppenheimer, 2004]. Information is sent continuously from the recorders (seismometers) to a central recording site (volcano observatory) where it is quantitatively and qualitatively analyzed [Banks et al., 1989] for use in short-term forecasting.
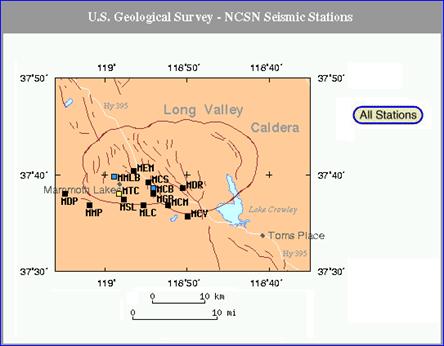
In the LVC, earthquakes are recorded by a network of 38 seismic stations. 18 are located throughout the caldera at various sites with 20 more residing outside [http://lvo.wr.usgs.gov/monitoring/index.html, 2003]. Each analog seismic station translates its recordings into an FM signal that is telemetered, in real-time, to the Long Valley Observatory (LVO) Field Center in Mammoth Lakes . From there the signal is relayed to USGS facilities in Menlo Park [Hill et al., 2002].
Figure 1. Map of seismic stations comprising the LVC seismic network. Figure reproduced from
http://quake.usgs.gov/waveforms/helimammoth/index.html.The LVC network comprises parts of both the Northern California Seismic Network (NCSN) and the Nevada seismic network operated by the University of Nevada, Reno [USGS Monitoring of Long Valley Caldera and Mono-Inyo Craters Volcanic Chain website, 2003]. It detects and locates magnitude earthquakes as low as M=0.3 and 90% or more of all magnitude M=1.2 and greater earthquakes in the LVC. Along the Mono-Inyo Craters, however, detection and location is harder and yields higher thresholds for events than in the LVC because of a smaller and less dense seismic network [Hill et al., 2001]
The dense network operating within the LVC provides real-time information that is useful in the short-term forecasting of future volcanic events. The seismic stations are placed at and around areas exhibiting unrest. One such station is located at the bottom of the Long Valley Exploratory Well (LVEW) 3 km below the surface of the resurgent dome [USGS Long Valley Exploratory Well website, 2003]. Data from the seismic recording stations is analyzed by a computer program (Earthworm/Earlybird) at LVO and Menlo Park . The program alerts the LVO and the seismologist on duty at Menlo Park of increases in seismic activity such as swarms of 20 or more small seismic events or one greater than or equal to M=3 event. Such information can be used by the USGS to update the Response Plan for Volcanic Hazards color code system [Hill et al., 2002].
The movement of magma and geothermal fluids beneath the surface directly affect the space (land) above it. We see evidence of this in the changing (�breathing�) topography of volcanic areas expressed as ground-deformation. Ground-deformation can be a precursory sign of volcanic eruption (though not always) and so its measurement and documentation are important in the short-term forecasting of future volcanic events [Banks et al., 1989].
ifferent modes of data collection are used to measure ground-deformation, both vertically and horizontally. According to Francis and Oppenheimer [2004], ground-deformation can happen rapidly (hours, days, etc.) and affect great areas (10-100's of Km3), so the need for the continuous measurement by electronic tiltmeters, strainmeters, laser ranging electronic distance measurement (EDM), and GPS is needed to create a frequently updated regional deformation map. A map of deformation data can give clues to the location of future volcanic eruption and the path of migration of magma and other geothermal fluids.
Electronic tiltmeters and strainmeters should be set in an array surrounding volcanic vents and other areas of uplift so as to measure completely the amount of vertical and horizontal deformation, respectively, occurring [Banks et al., 1989]. Tiltmeters, capable of measuring changes in angle as small as 1 microradian, are subject to unwanted thermal and meteorological effects and therefore should be installed in boreholes. The typical type of strainmeter used to measure the strain of volcanoes is the borehole dilatometer, sensitive to changes in strain as small as a few nanostrains (ppb) [Francis and Oppenheimer, 2004].
In the LVC, electronic tiltmeters and one long-base Michelson tiltmeter are used in an array to provide fast and constant information on the changes in tilt throughout the caldera. There are seven electronic borehole tiltmeters in the LVC array (Casa Diablo, Escape, Fossil, Little Antelope, Sherwin Creek, Valantine, and Motocross [http://quake.wr.usgs.gov/research/deformation/monitoring/lists/regiontable.html, 2005]) that are set 2 to 10 meters deep. These are capable of distinguishing changes in tilt from 5 to 10 microradians within a period of a few days to a week [Hill et al., 2002].
The long-based Michelson tiltmeter, located in the south mote of the caldera [LVC Monitoring Report website, 1998], is an L-shape device, measuring 0.5 Km to a side, buried underground. It is more stable and more accurate than the borehole tiltmeteres. Tilt change measurements can be made down to 0.1 microradian over periods of a week using this tiltmeter. The data from each tiltmeter in the LVC is telemetered to USGS facilities in Menlo Park every 10 minutes via the Geostationary Operational Environmental Satellite (GEOS) satellite and can be used to understand vertical deformation in the LVC [Hill et al., 2002].
Horizontal displacement in the LVC can be better understood with the use of borehole volumetric strainmeters (dilatometers). The LVO and the USGS facilities at Menlo Park utilize four dilatometers (Big Springs, Motocross, Phillips, and Devil's Postpile [http://quake.wr.usgs.gov/research/deformation/monitoring/lists/regiontable.html, 2005]) to measure strain throughout the caldera. Buried at depths of 200m, these dilatometers automatically transmit their data to Menlo Park every 10 minutes where the dilatational strain over the past hour is averaged and recorded by computer. Measurements of changes in strain can be can be resolved to better than 0.02 ppm over a period of several days making the observation of sudden strain changes useful in the short-term forecasting of volcanic events.
The use of tiltmeters and strainmeters to infer vertical and horizontal deformation can fill in only a small portion of the regional deformation map needed to fully monitor deformation in the LVC. For larger scale changes to be measured, geodetic methods such as laser ranging EDM and continuous GPS are used.
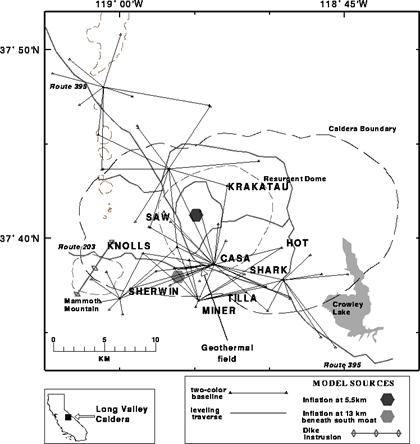
Laser ranging EDM is conducted in the LVC using a two-color geodimeter. The geodimeter measures changes in the distance of its lasers (baselines) between two fixed benchmarks [http://www.wovo.org/1203_14.htm, 1997]. Changes in distance covered by the lasers represent extension of the land (horizontal deformation). In the LVC, 78 baselines are measured throughout a given year with the two-color geodimeter. 8 of these, extending from Casa Diablo on the southern part of the resurgent dome, are monitored two to three times a week depending on weather [Hill et al., 2002]. Distance measurements from baseline length can measure distances down to an accuracy of 0.5 to 1.0mm for ranges between 3 and 8 km [http://quake.wr.usgs.gov/research/deformation/ twocolor/longvalley.html, 2005].
The two color EDM network within the LVC provides information to researchers about the horizontal deformation trends in the area. Trends observed since the beginning of regular measurement along the 8 baselines out of Casa Diablo include an abrupt extension rate to 5cm/yr from late 1989 to mid 1990 and a decrease to a rate of 3cm/yr that persists today [http://quake.wr.usgs.gov/research/deformation/twocolor/ longvalley.html, 2005]. The use of two-color EDM, however, is viewed as relying too much on costly and possible high risk manpower and is planned to be completely replaced by the continuous GPS network in coming years [Hill et al., 2002].
Figure 2. Two-color EDM baselines used to measure horizontal deformation in the LVC. Figure reproduced from http://quake.wr.usgs.gov/research/deformation/twocolor/lvnet.gif.
Deformation in the LVC, both vertical and horizontal, can be measured together almost immediately using GPS [Francis and Oppenheimer, 2004]. A network of 16 permanent stations, located at monuments in and outside the caldera, provides receivers for GPS signals [Hill et al., 2002]. Such a large GPS network provides deformation data for the entire area at a precision of 3mm horizontally and 8mm vertically [http://lvo.wr.usgs.gov/monitoring/index.html., 2005] 24 hours is needed, however, for this type of clarity but cm-level accuracy can be achieved by processing at real-time [Hill et al., 2002].
Combined, the data from tiltmeters, strainmeters, laser ranging EDM, and GPS along with the extremely accurate but difficult to collect data from leveling survey, create an extensive and accurate regional deformation map from which can be inferred the state of magma and other geothermal fluids beneath the surface of the LVC. Individual methods of deformation monitoring, such as tiltmeters and strainmeters, can provide short-term forecasts of volcanic events in the area. The regional geodetic network, however, provides long-term data on the regional deformation field and thus is used for long-term forecasts that would not affect the Response Plan for Volcanic Hazards color code system [Hill et al., 2002].
Another useful key in making forecasts of future volcanic events is the monitoring of gas emissions from volcanically active areas. As magma rises closer to the surface, the pressure affecting it is reduced allowing volcanic gasses to exsolve. Heating of surrounding rocks and the water envelope also cause gasses to be released and to move upward towards the surface where they are discharged into the soil or atmosphere [Banks et al., 1989]. During volcanic eruption gasses are also released and comprise part of the eruption plume. Monitoring of the release of gasses, a common precursor to volcanic eruption, can yield useful information about a volcanic area allowing forecasting and, during eruption, an understanding of the stage of eruption.
The types of gasses that commonly exude from volcanically active areas through volcanic vents, fumaroles, and hydrothermal systems are hazardous to people and to the ecology of a volcanic area. The most common of these is water vapor (H20). The gasses emitted that prove to be the most hazardous, though, are carbon dioxide (CO2), sulfur dioxide (SiO2), and hydrogen fluoride (HF) [http://volcanoes.usgs.gov/ Hazards/What/VolGas/volgas.html, 2005]. Of particular concern in the LVC is the emission of CO2 from beneath Mammoth Mountain .
After several small earthquakes below Mammoth Mountain in 1989 areas of tree kill were observed surrounding the mountain caused by CO2 emissions [Hill et al., 2001]. The areas of tree kill today cover 170 acres in six areas on the flanks of Mammoth Mountain . Year long measurements of CO2 and other gas emissions have been made since 1990 around Mammoth Mountain in an effort to understand the reservoir from which the gas is issuing [http://lvo.wr.usgs.gov/CO2.html, 2001].
Figure 3. CO2 flow rates at Horseshoe Lake . Reproduced from
http://lvo.wr.usgs.gov/CO2.htmlCO2 gas emissions in the Mammoth Mountain area are created by magma that has risen to within a few kilometers of the surface. These emissions can be measured through surveys of soil efflux and in the atmosphere surrounding Mammoth Mountain by plane. The rate of discharge at mammoth is measured by four continuous flux instruments at or near Horseshoe Lake , by plane surrounding Mammoth Mountain , and by portable flowmeter at 50-100 sites a day along an extensive sampling grid at tree kill areas surrounding the mountain. Each using an infrared LI-COR analyzer that records increasing concentrations of CO2 [http://volcanoes.usgs.gov/About/What/Monitor /Gas/soil.html, 2000].
The continuous and portable flowmeters used at Horseshoe Lake and the other tree kill areas around Mammoth mountain use an accumulation chamber, placed on and below the soil surface, to collect emitted gasses that are then analyzed by the infrared LI-COR. The LI-COR analyzer measures the concentration in the accumulation chamber as it increases to determine rate of increase for that particular location, fixed (continuous) or along the sampling grid (portable) [http://volcanoes.usgs.gov/About/What/Monitor /Gas/soil.html, 2000]. Plotting of the data from along the grid and the continuous flowmeters on a map yields a CO2 flow map of the area surrounding Mammoth Mountain and can show where the centers of efflux are located. These types of monitoring techniques put the rate of flux from the area at 50-150 tons of carbon dioxide a day [http://lvo.wr.usgs.gov /CO2.html, 2001].
The LI-COR infrared analyzer can also be fitted to an airplane that circles Mammoth Mountain at different altitudes, creating a �lampshade� around the mountain, in order to detect degassing of CO2 in the area. This technique only takes 1-2 hours and so is much faster than the use of the portable flowmeters along the sampling grid. Data collected November 13 th 1998 measured CO2 gas from 11, 6-7km orbits centered around the summit of Mammoth Mountain and determined that the gas was being emitted at a rate of 250 tons/day [http://volcanoes.usgs.gov/About/What/ Monitor/Gas/Mammoth .html, 2000].
Airborne surveying of CO2 around Mammoth Mountain , though, is only conducted one to two times a year to record baseline CO2 emission rates. Data recorded by the portable flowmeters and the stationary continuous flowmeters can be compared with the baseline data to identify changes in CO2 emission rates at Mammoth Mountain [Hill et al., 2002]. Data displaying uniform chemical and isotopic composition of the CO2 collected from the broad area around Mammoth Mountain suggests that all of the emission sites are fed by a singular reservoir of volcanic gas [http://lvo.wr.usgs.gov/ CO2.html, 2001]
Monitoring of gas emission at Mammoth Mountain has also recorded magmatic helium escaping from the Mammoth Mountain Fumarole (MMF). Emission rates of Helium at the MMF correspond to varying amounts of deformation in the area's crust. No SO2 has been observed in the Mammoth Mountain area, though monitoring for sulfur dioxide, by use of correlation-spectrometer (COSPEC) in airborne surveying, is possible [Hill et al., 2002].
CO2 gas emission is also measured throughout the Caldera by a network of monitoring stations. The gas-concentration monitoring network is composed of seven monitoring stations located in the south of the caldera and around Mammoth Mountain in the southwest. Each station pumps air from a collection chamber beneath the soil to CO2 sensors located in U.S. Forest Service structures. Data from each monitoring station is sent via the GOES satellite to the USGS Cascades Volcano Observatory in Vancouver , Washington every three hours [Hill et al., 2002].
Changes in seismicity, ground-deformation, and volcanic gas emission can act as precursors to volcanic eruption and provide information needed to forecast such future volcanic events. The Long Valley Caldera has been inhabited by large numbers of people since the gold rush of the 1850s and thousands more, today, visit the area for its scenery [Hill et al., 2000]. Volcanic activity in the area creates both immediate (CO2 emissions, earthquakes, etc.) and future (volcanic eruption) hazards that can destroy property and possibly kill residents and tourists.
After the 1978 earthquake swarm that ended a 20 year period of rest in the LVC and began the rise in the resurgent dome, a Response Plan for Volcano Hazards in the Long Valley and Mono Craters Region was developed by the USGS. A corresponding four level, color code to reflect progressively more intense volcanic activity within the region was also developed. Levels along the color code [GREEN (no immediate risk) to RED (ERUPTION IN PROGRESS)] correspond to various volcanic activity and provide suggested responses for monitoring geologists and government emergency officials [Hill et al., 1989].
Many other volcano monitoring techniques are used in the LVC (e.g. microgravity, geomagnetic, geoelectrical, synthetic aperture radar SAR, and thermal radiation) to collect data from which information and hypotheses about the state of volcanic fluids is inferred [Tilling et al., 1989]. Many of these techniques are theoretical and so are not as widely used as seismic, ground-deformation, and volcanic gas monitoring techniques. All, however, can be used to make short-term predictions of future volcanic events.
Monitoring techniques are calibrated on previous well documented volcanic events [Banks et al., 1989]. The LVC's last volcanic eruption took place 640 years ago. Also, the volcanic activity in the large silicic caldera is on a larger scale and does not exhibit the same behavior that many smaller volcanic chains exhibit. Signs of imminent eruption at smaller volcanoes seen in the LVC lead to nothing. This makes volcano monitoring and short-term forecasting in the LVC difficult. Monitored trends in Long Valley , however, would suggest that the next volcanic eruption is most likely to occur along the Mono-Inyo chain [Hill et al., 2000].
Based on the information provided by the monitoring of gas emissions at Mammoth Mountain and the ground deformation and microgravity at the resurgent dome, we know that these are the two areas of the most recent magma intrusions. I infer from this data that the next eruption within the Long Valley Caldera will occur at Mammoth Mountain , an area of geologically recent volcanism, recent magma intrusion, and gas emission. It is also the southernmost part of the Mono-Inyo Volcanic Chain which is forecast by the USGS, based on geologic eruptive history, as the next part of the caldera that will erupt [Hill et al.,2000].
References:
Books and Journals
1. Banks, G. Norman et al., 1989, Chapter 4: Volcano Monitoring and Short-Term Forecasts, in Short Course in Geology: Volume 1, Volcanic Hazards , Washington D.C. : American Geophysical Union .
2. Hill, David P. et al., 2002, Response Plan for Volcano Hazards in the Long Valley Caldera and Mono Craters Region, California, USGS Bulletin 2185, Published by United States Government Printing Office.
3. Peter Francis and Clive Oppenheimer, 2004, Chapter 17: Volcano Monitoring, in Volcanoes, New York : Oxford University Press.
4. Tilling, Robert I. , 1989, Introduction, in Short Course in Geology: Volume 1, Volcanic Hazards , Washington D.C. : American Geophysical Union .
Fact Sheets and Websites
1. Hill, David P. et al., 1998, Future Eruptions in California's Long Valley Area-What's Likely?, USGS Fact Sheet-073-97, Published by United States Government Printing Office.
2. Hill, David P. et al., 2000, Living With a Restless Caldera-Long Valley , California , USGS Fact-108-96, Published by United States Government Printing Office.
3. http://volcanoes.usgs.gov/About/What/Monitor/Seis/SeisMonitor.html, 2000
4. http://lvo.wr.usgs.gov/monitoring/index.html, 2003
5. http://quake.wr.usgs.gov/research/deformation/monitoring/lists/regiontable.html, 2005
6. http://www.wovo.org/1203_14.htm, 1997
7. http://quake.wr.usgs.gov/research/deformation/twocolor/longvalley.html, 2005
8. http://volcanoes.usgs.gov/Hazards/What/VolGas/volgas.html, 2005
9. http://lvo.wr.usgs.gov/CO2.html, 2001
10. http://volcanoes.usgs.gov/About/What/Monitor /Gas/soil.html, 2000
11. http://volcanoes.usgs.gov/About/What/ Monitor/Gas/Mammoth.html, 2000
Figures
1. Title page illustration reproduced from http://lvo.wr.usgs.gov/monitoring/index.html, 2003.
2. Figure 1 reproduced from http://quake.usgs.gov/waveforms/helimammoth/index.html, 2005.
3. Figure 2 reproduced from http://quake.wr.usgs.gov/research/deformation/twocolor/lvnet.gif, 2003.
4. Figure 3 reproduced from http://lvo.wr.usgs.gov/CO2.html, 2001.
