Geology and Natural Heritage of the Long Valley Caldera
It's Gonna Blow! A Look at the Science of Volcanic Activity Prediction, Focusing on the Long Valley Caldera
Samuel Shepson
Since the dawn of history, volcanoes have been an awe inspiring feature of the earth that has frightened and intrigued mankind. Volcanoes have taken the lives of over 250,000 people in the last three hundred years and changed the lives of millions of others, but up until recently humans have had very little understanding of the volcanic processes that presage an eruption. The advent and implementation of new technologies and scientific methods has allowed us to begin to comprehend the inner workings of one of nature's most powerful forces. Through understanding how volcanoes work, volcanologists hope to accurately predict when an eruption may occur, what the magnitude and type of eruption will be, and what effect it will have on the surrounding area. Accomplishing this daunting task will ensure that in the future when an eruption occurs, the population at risk will be prepared and lives can be saved.
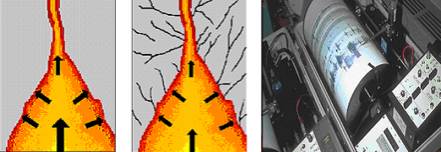
Numerous methods are available for monitoring volcanic activity, and scientists typically synthesize data and observations from all methods available in order to obtain the most comprehensive look at the area being observed. One frequently used technique is monitoring seismic activity that may indicate flow of magma and gas beneath the surface. As magma at extreme temperatures of sometimes over one thousand
Degrees Celsius rises through cracks in the Earth's crust, the intense temperature and pressure causes the surrounding rock to crack, as illustrated in the diagram above. This brittle fracture of the surrounding rock often causes earthquakes or vibrations called tremors. Usually these earthquakes are of magnitude 2, 3 or lower, and seismographs monitor these quakes so that they can be analyzed. Generally these small earthquakes increase in frequency prior to a volcanic eruption, but this is not always the case.
The graph to the right displays the number of earthquakes in the months leading up to three eruptions that occurred on June 27, August 18, and September 16-17 of 1992 at Mt. Spurr, located 80 miles west of Anchorage, Alaska. The vertical red lines indicate the eruptions. The graph shows that there was an erratic but visible increase in the frequency of seismic activity leading up to the first eruption. It also shows that the second and third eruptions were not preceded by a marked increase in seismic activity, and that during two weeks following the last eruption in November and December, a large frequency of earthquakes took place without an eruption occurring afterwards. This illustrates how difficult it can be to predict when an eruption is likely to take place and underscores the importance of using several methods concurrently to predict volcanism.
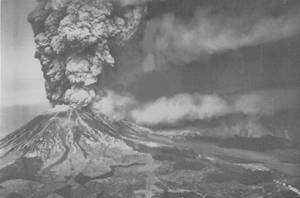
Monitoring ground deformation in the vicinity of a volcano is another valuable tool for understanding what's going on underground. When magma rises, it often causes the rock above it to deform or uplift in the form of a dome, and these domes indicate activity below the surface that could be a warning sign of an eruption. One of the most dramatic occurrences of uplift occurred prior to the Mt. St. Helens eruption of 1980 when the volcano's north side bulged out over 100 meters in only two months. Scientists and technicians measure both horizontal and vertical ground movement, as well as measuring changes in angle of the ground. A variety of techniques and equipment are employed to obtain this data that is an important part of the prediction process.
Up until recently, the most commonly used method to measure horizontal change within a caldera or on a resurgent dome was using an Electronic Distance Measuring system, or EDM. Essentially the EDM consists of an instrument that sends an electromagnetic signal to a reflector, which sends the signal back to the instrument where it is received and distance is calculated. Although EDMs can be accurate down to just a few millimeters, they have the drawback that the instrument and reflector must be within visibility of each other, which can be difficult on steep slopes and can be affected by bad weather. In recent years, GPS or Global Positioning Systems have begun to replace EDMs because they offer several advantages. GPS uses a network of 24 satellites that can measure both horizontal and vertical displacement to a high level of accuracy that is not affected by weather and is not dependent on a line of sight.
As magma moves below a resurgent dome, it will often cause a change in the angle of rock above it, and this change is measured with a device called a tiltmeter. These instruments are essentially an extremely sensitive carpenter's level, accurate enough to sense change as small as 0.00006 of a degree. Another method which is becoming more widely used to measure all aspects of ground deformation is called satellite radar inferometry. This process utilizes radar signals sent from satellites that bounce of the earth surface and return a signal to the satellite that eventually produces data for the area that is being surveyed, as modeled above. The advantage of this method is that it gives scientists a look at the entire area that they are monitoring, and not just data from a few different benchmarks that only give a representative sample of data from the area. It also decreases the risk for human error that can occur if instruments are not precisely leveled and centered over benchmarks.
Monitoring the efflux of gases from volcanic plumes, the air surrounding volcanoes, fumerole emissions, and measuring the gas content of surrounding soil is an important part of understanding what is going on inside of a volcano. An increase or decrease in the levels of gases such as CO2, SO2, H2, CO, H2O, He, H2S, and the radon isotope 222Rn are signs of rising magma and are often precursors to volcanic eruptions. This was the case prior to the Mt. St. Helens eruption when CO2 emissions from a fumerole near the peak were significantly smaller and SO2 andH2S levels were markedly higher. Volcanologists monitoring the mountain were able to detect the anomaly because they had been maintaining a baseline, or ongoing sampling of the air on the flanks of the volcano, giving them a basis for comparison. In this case, monitoring the change in the geochemical content did in fact indicate magma rising to a shallower location in the volcano, and volcanologists were able to see the eruption coming.
Maintaining a baseline of sampling at centers of volcanic activity is still a burgeoning practice, and it faces several difficulties. One is that sampling the gas often requires scientists to visit dangerous and remote locations that can be subject to severe weather and sudden eruptions. Monitoring from aircraft is a possibility, but it requires significant funding and appropriate weather to do so. High winds can often dissipate gas emissions and alter their relative concentrations making getting an accurate sample a challenge. Also, some gases such as SO2 that are soluble in water are difficult to measure at volcanoes with surface lakes or in places with significant amounts of groundwater.
Although it is difficult to measure, an increase in thermal energy may be a sign of future volcanic activity. This increase may make itself evident through volcanic lakes increasing in temperature and evaporation rate, as was the case at Po?s in Costa Rica when the volcanic lake there evaporated completely before the eruption in April 1989. When the water had disappeared, liquid sulfur deposits were visible at the bottom of where the lake had once been, giving a solid sign that the volcano would soon erupt.
Microgravity sensors are another tool for detecting rising magma within volcanoes. Highly sensitive instruments can detect an increase in density of the rock below it by measuring the minute increase in the gravitational pull that occurs due to the extra mass that has intruded into the area. Because the force of gravity changes with elevation, one must be able to identify what gravitational change is a product of altitude versus what change is caused by intruding magma.
Monitoring geoelectrical changes in a volcano is another newly developed method for detecting upwelling magma. The resistivity of rock is primarily dependent upon porosity and temperature, and both of these characteristics change as magma moves through fissures in surrounding rock. Measuring these tiny changes is difficult, and has yet to be implemented in a large number of areas worldwide.
An even younger technique that is useful in volcanic prediction is surveying geomagnetic changes beneath a volcano. The development of proton precession magnetometers in the 1960's made it possible to take continuous measurements of the intensity of the Earth's magnetic field. Since this instrument was invented, it has been used to show that volcanic activity can produce magnetic signals that are quite small, but detectable with proper instrumentation.
One of the toughest tasks that volcanologists are faced with is informing the public about the current volcanic situation in their area. After data is obtained and analyzed, volcanologists must make a decision about at what point an eruption is likely and at what point the public should be notified. This is indeed a tricky business because the wrong decisions could bring the credibility of issued warnings and of the scientists themselves into question. If warnings are issued too haphazardly or frequently, the public would likely not take heed of the warnings, which could easily end in tragedy. This might lead volcanologists to be hesitant about issuing warnings, and if a warning is not given before an eruption, the consequences could be catastrophic. The USGS makes it clear in the disclaimer available on their website that although they strive to make the most accurate predictions based on their data, they provide no warranty on the quality of the information that they have provided.
Scientists studying the Long Valley Caldera in California are indeed no strangers to this difficult task. The magnitude 5.6 earthquake that struck 6 miles southeast of the caldera in 1978 marked the end of low quake activity in the area and the beginning of great concern for a possible eruption in the Long Valley area. Many of the warnings signs discussed in the preceding pages soon began occurring in the caldera, and the area has been under intense observation and analysis since.
An intense swarm of earthquakes occurred in May of 1980, including four magnitude 6 quakes, three of which occurrred on the same day. Following these swarms, the USGS expanded their network of seismometers to more closely monitor activity in the area. Today, there are 18 seismic stations within the caldera and 20 within 50 km of the caldera boundary, some operated by the Northern California Seismic Network (a division of USGS), and some by the University of Nevada.
Since 1979, rising magma has caused the center of the caldera to uplift 2.5 feet, after being stable for decades. In the four years between 1988 and 1992 the resurgent dome widened by 13 cm, and GPS and EDM monitors continuously obtain data on the current condition of the dome.
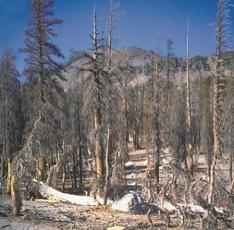
A small swarm of earthquakes occurred from May to November of 1989 beneath Mammoth Mountain, a popular skiing, hiking, and camping resort within the caldera boundary. In the year following the quakes, trees surrounding the mountain began to die off rapidly. Initially it was thought that the tree kills were caused by insects, but when a scientist nearly fainted when he was in the area, it was soon discovered that the trees were dying because of inflated levels of carbon dioxide in the soil. Because CO2 is almost completely insoluble in magma, as magma rises towards the surface carbon dioxide is one of the most common gases effused. CO2 levels in the soil of tree kill areas reached almost 95% of the gas content in some areas, a drastically higher percentage from the normal 1% or less. Breathing air with over a 30% concentration of carbon dioxide can quickly be fatal, and because CO2 is denser than air, depressions in the ground or snow that are poorly ventilated can be very dangerous to human and plant life. Today, over 100 acres of trees on Mammoth have been killed, and CO2 levels are monitored periodically.
It is important to note that between 1988 and 1992, the Long Valley experienced earthquake swarms, both horizontal and vertical expansion, and emission of carbon dioxide. This seems to indicate that these processes are interdependent, and that there are many variables that affect the science of volcanic prediction. Thusly many different methods are necessary to really understand what is happening in Long Valley and for other volcanic areas worldwide.
Monitoring the extensive hydrological system present in the Long Valley area is another important aspect of the work of scientists in the area. The hot springs, fumeroles, and lakes in the area are monitored in an effort to better understand how water composition, water levels, and temperatures change with geological happenings. The construction of the 3 km deep Long Valley Exploratory well (right) will allow further study of the hydrological system of the area. In August of 2003, the USGS installed a 90 foot instrument package 7500 feet below the surface of the well that will measure seismicity, deformation, and fluid pressure within the resurgent dome.
Tiltmeters, EDMs, and continuous GPS monitors are in use throughout Long Valley, and magnometers in the caldera measure changes as small as 1/50,000th of the earth's total magnetic field. With all this technical equipment being used, one might forget one of the most useful tools for analyzing the geologic and volcanic processes in the area: the five senses of an experienced volcano observer. For example, on a particular resurgent dome in the caldera, one can feel the heat coming from the ground with one's hand, and infer that the heating is caused by magmatic activity.
Over the past 5,000 years, an eruption has occurred in the Long Valley area every 250 to 700 years, the most recent of which took place about 250 years ago at Paoha Island in Mono Lake. One might think that with everything from carbon dioxide emissions to ground upwelling to seismic activity in the area that an eruption might be just around the corner. While an eruption is a possibility, it is certainly not guaranteed for the near future as periods of unrest such as the one occurring right now in Long Valley have been known to continue for tens or even hundreds of years in other calderas around the world. To deal with the possibility of an eruption, the USGS has developed an interface between scientists and the public that translates all of the information gathered by geologists and volcanologists to an alert level system that puts things in simplified form for the lay person. Because of the high influx of tourists in and out of the Mammoth area, keeping the public informed is essential for saving people from things like mudflows which could be caused by the heat from an eruption. Whether the next eruption draws nigh or not, folks in Long Valley can rest assured that dedicated geologists, geochemists, geophysicists, and volcanologists are keeping an eye on Mother Nature.
Works Cited